filmov
tv
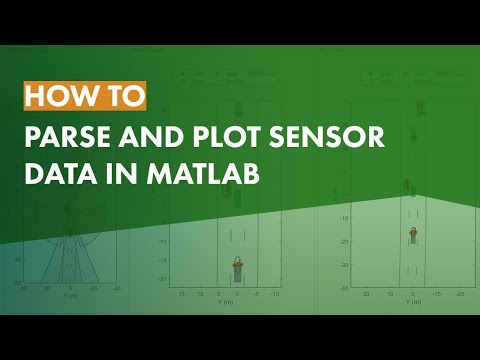
How to Parse and Plot Sensor Data in MATLAB

Показать описание
Parse recorded radar, camera and lane data, create a birds-eye plot and configure it to display sensor coverages, sensor data and lane data for single and multiple timesteps. For more information on how to use MATLAB to visualize sensor data, visit the following links:
--------------------------------------------------------------------------------------------------------
© 2021 The MathWorks, Inc. MATLAB and Simulink are registered trademarks of The MathWorks, Inc.
--------------------------------------------------------------------------------------------------------
© 2021 The MathWorks, Inc. MATLAB and Simulink are registered trademarks of The MathWorks, Inc.
 0:06:38
How to Parse and Plot Sensor Data in MATLAB
 0:05:35
2 - Parse and plot your data
 0:18:01
Ep. 4 How to read files, parse data and create plots using Python
 0:16:12
Python Tutorial: CSV Module - How to Read, Parse, and Write CSV Files
 0:10:07
Parse XML Files with Python - Basics in 10 Minutes
 0:00:16
Drag and Drop to Plot CSV data in PyQT5 | link in description
 0:22:47
PYTHON TUTORIAL :How to Read Excel File and Do Basic Plotting
 0:21:59
Ep. 3 How to read files, parse data and create plots using MATLAB
 0:04:41
Python Tutorial: Plotting with pandas
 0:18:07
READ, PLOT, Parse dates, index column, Organize, and write.CSV in python jupyter with PANDAS.
 0:01:00
How To Plot A Graph With Data From A CSV File In Python | Python For Beginners
 0:03:58
DBMS - Query Representation using Operator Graph
 0:35:41
Python Pandas Tutorial (Part 10): Working with Dates and Time Series Data
 0:23:53
FAIRmat Tutorial 8: Tabular parsers and adding plots
 0:16:45
Read,plot, Parse dates, index_column, statistics, write .CSV in python jupyter with PANDAS. part_2
 0:06:38
Python 3 Programming Tutorial - Scatter plots and bar charts
 0:14:49
Matplotlib Tutorial (Part 4): Stack Plots
 0:08:25
How to Read from a text .txt file in Python! Pulling in data and filtering and modifying the info!
 0:02:45
Basics - How to read a CSV file in python (and plot it)
 0:16:16
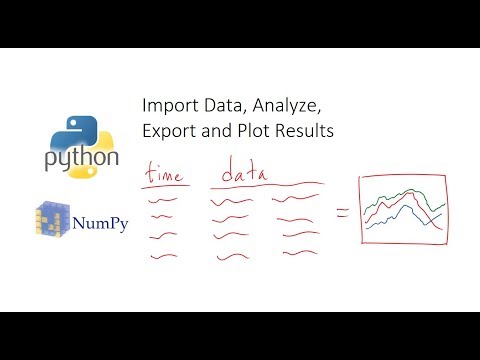
Import Data, Analyze, Export and Plot in Python
 0:02:25
How to Parse Date Columns in CSV Files with Pandas & Python
 0:38:31
Complete Data Science Project!
 0:09:05
Read,plot, Parse dates, index_column, statistics, write .CSV in python jupyter with PANDAS. part_3
 0:00:39
Versatile scatter plots using matplotlib
Комментарии