filmov
tv
R demo | Correlation | Pearson, Spearman, Robust, Bayesian | How to conduct, visualise and interpret

Показать описание
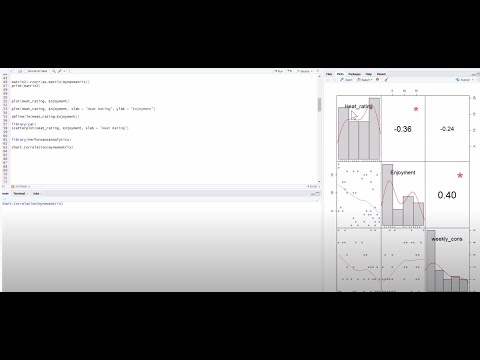
Having two numeric variables, we often wanna know whether they are correlated and how. One simple command can answer both questions by visualizing the data and conducting frequentists and bayesian correlation analysis at the same time. So, let’s learn how to do that, how to interpret all these results and how to choose the right correlation method in the first place.
Here is a quick R code:
library(ggstatsplot)
ggscatterstats(
data = mtcars,
x = mpg,
y = hp,
type = "p") # or "np" or "r"
?ggscatterstats
If you only want more code (or want to support me), consider join the channel (join button below any of the videos), because I provide the code upon members requests.
Enjoy! 🥳
 0:04:26
R demo | Correlation | Pearson, Spearman, Robust, Bayesian | How to conduct, visualise and interpret...
 0:07:50
Pearson correlation [Simply explained]
 0:04:55
Pearson's Correlation Coefficients in R
 0:09:26
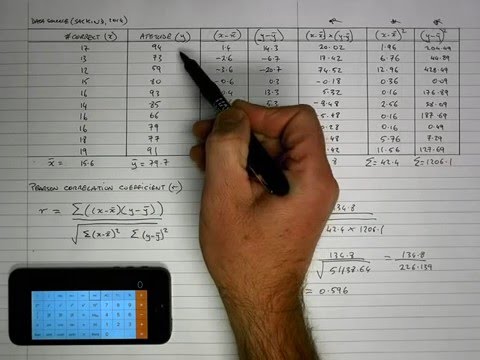
How To... Calculate Pearson's Correlation Coefficient (r) by Hand
 0:05:46
How To... Calculate Correlation Coefficients in R #79
 0:09:19
Video 5 - Using RStudio to do Pearson and Spearman CorrelationTests
 0:03:06
Performing a Pearson r correlation in R Studio
 0:04:56
R demo | Correlation Matrix | How to conduct, visualise and interpret
 0:14:07
Calculating Correlation (Pearson's r)
 0:08:48
Pearson's correlation matrix with p-values in R
 0:08:55
Correlation in R
 0:11:04
Visualization of correlation matrix in R | ggcorrplot tutorial | ggplot2 extension | R Tutorial
 0:05:40
Correlation analysis
 0:08:37
How to Calculate Correlation Coefficients in R (5 Examples) | cor() Function | Pearson, Kendall &...
 0:09:17
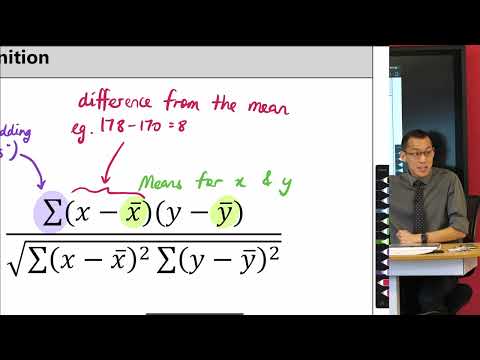
Pearson's Correlation Coefficient (1 of 3: Unpacking the formula)
 0:06:34
Correlation in R | Pearson correlation coefficients with significance** , p-values and Heat map|
 0:05:12
Karl Pearson's Correlation Coefficient in R Studio || Dr. Atman Shah || SXCA
 0:02:19
Correlation analysis in R | Correlation Plot in R corrplot|Pearson's Correlation
 0:22:12
R Tutorial: Pearson's and Spearman's Correlation.
 0:06:01
How To... Create a Correlation Matrix in R #98
 0:03:20
Correlation Coefficient in R | Pearson Correlation | Spearman Correlation | Kendall Correlation
 0:12:55
Correlation Demo Pearson
 0:12:07
Plot Pearson Correlation Coefficient of Multiple Variables|| R Studio
 0:01:22
Pearson r Demo
Комментарии