filmov
tv
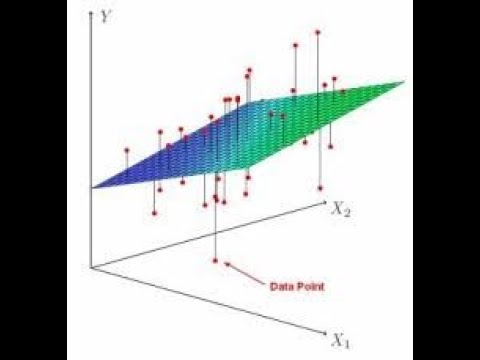
Machine Learning: Python Multiple Linear Regression | Predict house price | Predictive Analytics

Показать описание
This Linear regression tutorial performs a multi regression task on a target variable based on many independent variables on a housing dataset. It is a step by step tutorial that guides you through Exploratory Data Analysis. Data Processing, fixing Skewness, Encoding Categorical Variables and treating missing or NaN values. Once the data in proper shape we create and train the Linear Regression model.
We use training dataset that has property attributes and corresponding Sale Price. We train a linear regression model using sklearn library. Using this regression model we then predict, check predictions accuracy and compare it against actuals.
To download date and Notebook go to:
Click on a green button to clone or download the entire repository and then go to relevant folder to get access to that specific file.
Link to Exploratory Data Analysis with Python video:
#MachineLearning #LinearRegression #MultiLinearRegression
Topics covered in this Machine Learning Video:
0:00 Multiple linear regression Overview
1:02 Factors to consider
1:47 Import required libraries
2:20 Import data in dataframe
2:39 Exploratory data analysis
3:56 Correlation
4:36 Scatter plot
5:33 Data Distribution - density plot
5:57 Data Preprocessing
6:12 Remove Outliers and missing values
6:40 Encoding Categorical Data
7:49 Log transformation
8:23 Split data in train and test
9:23 Create and train Linear Regression model
9:39 Check accuracy of predictions
9:50 Predict a single value
10:39 Compare Actual vs Predicted values
11:10 Model preview in web app
 0:14:08
Machine Learning Tutorial Python - 3: Linear Regression Multiple Variables
 0:37:22
How to Implement Multiple Linear Regression in Python From Scratch
 0:00:19
Multiple linear regression model in python
 0:21:37
Machine Learning Multiple Linear Regression using Python - Practical
 0:12:04
Machine Learning: Python Multiple Linear Regression | Predict house price | Predictive Analytics
 0:04:40
Multi Linear Regression Tutorial | Machine Learning & Data Science with Python
 0:09:02
Multiple Regression - Machine Learning in Python Tutorial (Lesson 2)
 0:12:51
Multiple Linear Regression in Python with SKLEARN
 1:06:28
Accelerating Python Data Science at NVIDIA - Talk Python Live Stream
 0:22:30
Machine Learning with Python | Multiple Linear Regression with Solved Examples - P10
 0:08:48
Python Jupyter machine learning (multiple linear regression)
 0:23:22
Multiple Linear Regression | Machine Learning with Python Tutorials p.1
 1:02:19
Multiple Linear Regression Python Sklearn:Machine Learning
 0:26:39
Multiple Linear Regression | Machine Learning with Python Tutorials p.2
 0:10:35
Multiple Linear Regression in Python - sklearn
 0:20:57
Multiple Linear Regression | Geometric Intuition & Code
 0:09:10
Multiple Linear Regression Machine Learning Algorithm in Python and Sklearn
 0:01:00
Linear Regression with Python in 60 Seconds #shorts
 0:19:51
Multiple Linear Regression using python and sklearn
 0:00:33
Implement Multiple Linear Regression in Python: Predict Real Estate Prices with High Accuracy!
 0:13:03
machine learning with python video 13 : multiple linear regression
 0:00:06
Python Bytes - Linear Regression Prediction #python #datascience #coding Code in Description
 0:02:34
Linear Regression in 2 minutes
 0:50:52
Linear Regression in Python - Full Project for Beginners
Комментарии