filmov
tv
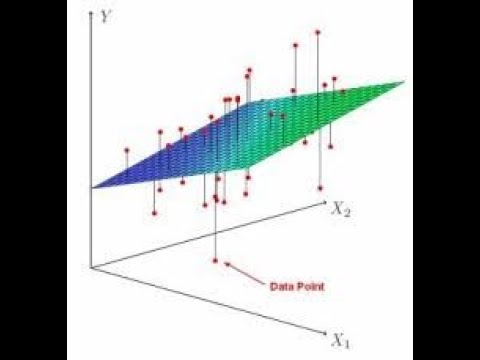
Multiple Linear Regression in Python - sklearn

Показать описание
Unlock the power of multiple linear regression using Python’s sklearn library with our step-by-step tutorial. This video is designed to help you master the art of predicting outcomes based on multiple variables. Learn how to set up your Python environment, import necessary libraries, and load datasets for analysis. We guide you through the process of fitting a multiple linear regression model, interpreting coefficients, and evaluating model performance with real-world examples. Whether you're a data science enthusiast or a professional looking to enhance your analytical skills, this tutorial provides clear, concise explanations and practical applications. Understand how to handle multicollinearity and improve your model's accuracy with tips and tricks from experts. Subscribe to our channel for more in-depth Python and data science tutorials, and elevate your ability to derive insights from complex datasets with multiple linear regression. Join us and start predicting with precision today!
If you are a complete beginner in machine learning, please watch the video on simple linear regression from this link before and learn the basic concepts first:
Here is the dataset used in this video:
Please feel free to check out my Data Science blog where you will find a lot of data visualization, exploratory data analysis, statistical analysis, machine learning, natural language processing, and computer vision tutorials and projects:
Twitter page:
Facebook Page:
#linearRegression #machinelearning #datascience #dataAnalytics #python #sklearn #jupyternotebook
 0:10:35
Multiple Linear Regression in Python - sklearn
 0:37:22
How to Implement Multiple Linear Regression in Python From Scratch
 0:14:08
Machine Learning Tutorial Python - 3: Linear Regression Multiple Variables
 0:22:00
How to do Multiple Linear Regression in Python| Jupyter Notebook|Sklearn
 0:25:58
Mastering Multiple Linear Regression in Scikit-Learn: A Step-by-Step Guide
 0:19:51
Multiple Linear Regression using python and sklearn
 0:46:22
python - multiple regression with statsmodels
 0:16:23
Multiple Linear Regression using python ( Regression Analysis )
 0:12:47
Data Science for Everyone 9-4 Multiple Regression Analysis
 0:09:55
Multiple Linear Regression in Python
 0:16:47
Implementing Multiple Linear Regression in Python
 0:13:13
How to Perform Multiple Linear Regression Assumptions Test in Python
 0:09:13
Multiple regression in Python with statsmodels
 0:16:29
Multiple Linear Regression in Python from Scratch | Explained Simply
 0:08:25
How to Visualize Multiple Linear Regression in python
 0:14:12
#2. Multiple Linear Regression Model Building #python #datascience #machinelearning
 0:11:31
42- Multiple Linear Regression and Machine Learning in Python-(Day-20)
 0:17:46
Machine Learning in Python: Building a Linear Regression Model
 0:13:03
machine learning with python video 13 : multiple linear regression
 0:35:46
Linear Regression Analysis | Linear Regression in Python | Machine Learning Algorithms | Simplilearn
 0:12:07
5 - Multiple Linear Regression (Least Squares Approach) Matrix Implementation in Python
 0:01:00
Linear Regression with Python in 60 Seconds #shorts
 0:20:57
Multiple Linear Regression | Geometric Intuition & Code
 0:05:25
Multiple Regression, Clearly Explained!!!
Комментарии