filmov
tv
Histograms in R with ggplot and geom_histogram() [R-Graph Gallery Tutorial]

Показать описание
In this tutorial I show how to create Histograms in R with hist() and geom_histogram().
The examples are based in the R-Graph Gallery. I show how histograms can be used to visualize multiple different distributions at once.
⏱ Time Stamps ⌚
0:00 - Intro and video overview
0:58 - hist() and cut() function for histograms
3:18 - geom_histogram() function arguments
4:25 - Mirror histogram plot
5:12 - Multiple histograms with position
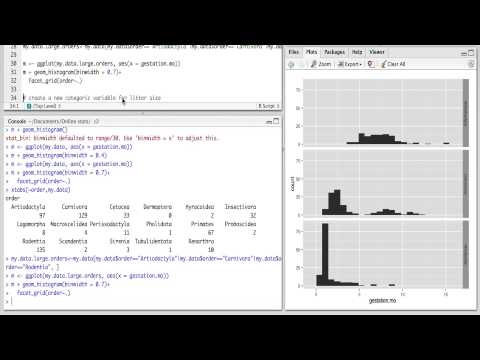
6:35 - Multiple histograms with facet_wrap
8:10 - Marginal distributions
9:00 - Age/population pyramid
External Links:
Background Music:
The examples are based in the R-Graph Gallery. I show how histograms can be used to visualize multiple different distributions at once.
⏱ Time Stamps ⌚
0:00 - Intro and video overview
0:58 - hist() and cut() function for histograms
3:18 - geom_histogram() function arguments
4:25 - Mirror histogram plot
5:12 - Multiple histograms with position
6:35 - Multiple histograms with facet_wrap
8:10 - Marginal distributions
9:00 - Age/population pyramid
External Links:
Background Music:
 0:08:45
How to Make a Histogram in R with ggplot
 0:11:34
Histograms in R with ggplot and geom_histogram() [R-Graph Gallery Tutorial]
 0:11:21
histograms in R's ggplot
 0:06:17
Creating Histograms using ggplot2 in R
 0:08:32
Data Visualization in R: Histograms using ggplot2
 0:18:22
Bar charts and Histograms using ggplot in R
 0:06:30
Histogramm in R mit ggplot erstellen - Daten visualisieren in R (27)
 0:10:27
Creating Histograms with R (using ggplot)
 11:54:57
R data visualization ggplot2 session 198
 0:16:55
R Basics 15: Histograms in ggplot
 0:05:52
DATA VISUALIZATION IN R - Marginal Histograms in ggplot
 0:04:07
Plotting in R using ggplot2: Mirrored histograms (Data Visualization Basics in R #18)
 0:03:19
Histograms in R using simple, ggplot2 and ggvis Methods
 0:25:22
Histograms in ggplot2
 0:01:36
Creating histograms with ggplot2
 0:07:32
Chapter 8 Video 3 - Histograms with One Variable in R (with ggplot2)
 0:01:40
Plotting in R using ggplot2: Stacked Histograms (Data Visualization Basics in R #13)
 0:03:31
Histograms in R Studio using ggplot | Descriptive Statistics in R Studio | Online R -Studio Tutor
 0:05:17
Create Beautiful Histograms in R with ggplot2 | Data Visualisation
 0:03:40
Histograms with a normal curve using ggplot2 in R
 0:02:16
How To Make a Histogram in R
 0:03:31
Draw Multiple Overlaid Histograms with ggplot2 Package in R (Example) | Overlaying Graph in RStudio
 0:11:01
Histograms in ggplot2
 0:00:14
Base R vs. ggplot2 - Histograms! #rstats #RStudio #datavisualization #ggplot2 #datascience
Комментарии