filmov
tv
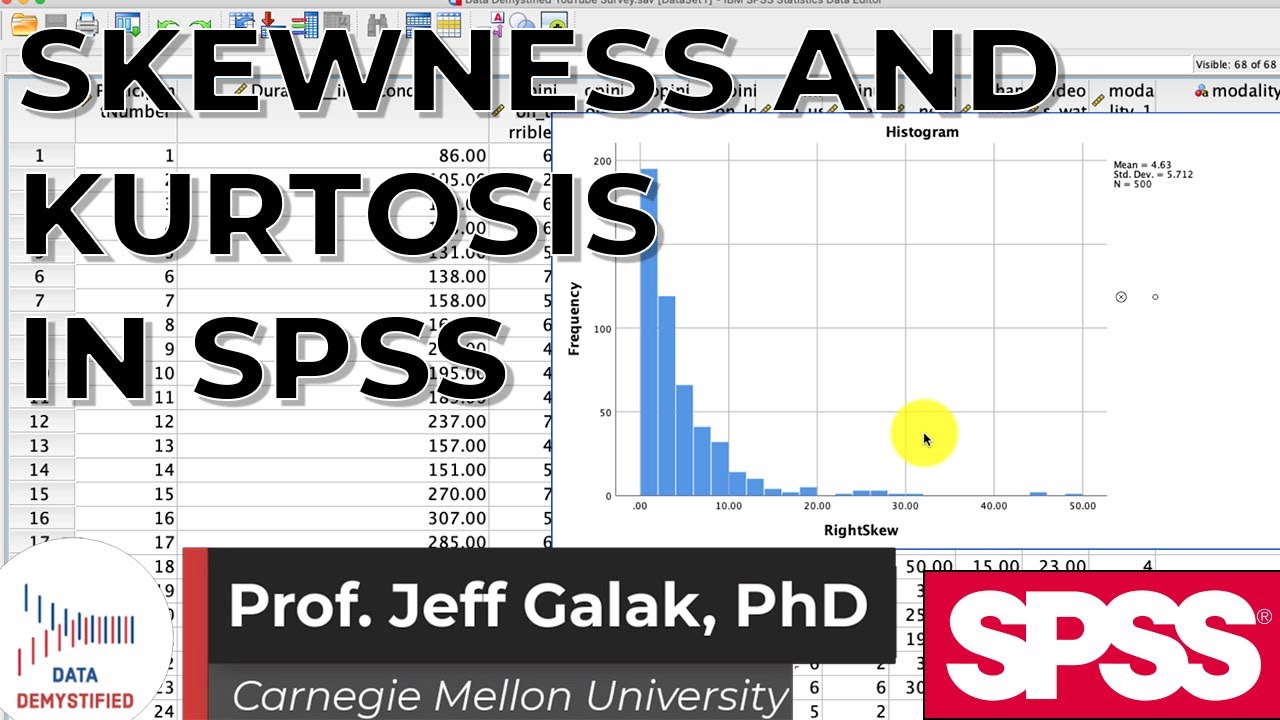
Skewness and Kurtosis with SPSS Tutorial (SPSS Tutorial Video #11)
Показать описание
In this video, I show you how to determine and interpret the SKEWNESS and KURTOSIS of a distribution. These are two useful metrics for describing the shape of a distribution. I also give you a chance to try and to it yourself.
This SPSS tutorial series is designed to teach you the basics of how to analyze and interpret the results of data using SPSS. I will cover everything from the very basics of the main windows within SPSS, to manipulating data, to running and interpreting meaningful analyses like t-tests, ANOVA, regression, and many more, and visualizing results.
Follow me at:
Equipment Used for Filming:
 0:06:51
Skewness and Kurtosis with SPSS Tutorial (SPSS Tutorial Video #11)
 0:03:50
SPSS (7): Descriptive Statistics | Mean, Range, Standard Deviation, Skewness, Kurtosis
 0:03:34
Skewness - SPSS (part 1)
 0:00:30
V2.7 - How to calculate kurtosis - SPSS (Sleep Data)
 0:11:44
SPSS: Skew and Kurtosis (Non-Normal Distributions) - 3 different ways
 0:04:32
Schiefe und Kurtosis in SPSS - Test auf Normalverteilung der Daten - Daten analysieren in SPSS (34)
 0:02:12
Skewness and Kurtosis in SPSS
 0:04:37
V6 17 - Skew, kurtosis & histograms across groups in SPSS
 0:00:45
Nonparametric Statistics by Corder/Foreman C2 find Skewness and Kurtosis with SPSS
 0:04:39
Calculating Skewness and Kurtosis Coefficients in IBM SPSS
 0:01:23
SPSS Skewness & Kurtosis
 0:08:32
Kurtosis in SPSS exploring normal distribution of data
 0:16:23
Checking normality using skewness, kurtosis, Kolmogorov–Smirnov and Shapiro-Wilk tests
 0:08:20
SD, Variance, Skew, Kurtosis and Standardized Scores in SPSS
 0:06:48
An example Descriptive Statistics, Skew And Kurtosis in SPSS [SPSS] [Descriptive Statistics]
 0:06:02
Skewness And Kurtosis And Moments | What Is Skewness And Kurtosis? | Statistics | Simplilearn
 0:08:21
What is Skewness & Kurtosis ? | Difference Between Skewness and Kurtosis in Statistics
 0:03:05
Kurtosis - SPSS (part 1)
 0:00:45
SPSS - Mean, Median, Mode, Standard Deviation & Range
 0:10:22
Normality Tests for Skewness And Kurtosis With SPSS
 0:15:12
Data Transformation for Positively and Negatively Skewed Distributions in SPSS
 0:13:46
How to check Data Normality, calculate and interpret descriptive statistics in SPSS (Lesson 7)
 0:07:17
Normallik Testi SPSS, Normal dağılım testi, Normal Dağılmayan Veri için Çözümler
 0:02:32
How to conduct descriptive analysis in SPSS || Mean / Median / Mode / SD / Skew & Kurtosis
Комментарии