filmov
tv
Logistic Regression I | Statistics for Applied Epidemiology | Tutorial 5

Показать описание
In this tutorial you will learn to Interpret simple logistic regression output and calculating ORs with:
– Binary X variable
– Continuous X variable
– X variable with multiple categories
You will also learn about estimating the log-odds of an outcome
►► Watch More:
Follow MarinStatsLectures
This statistics tutorial is prepared to support SPPH 500: Analytic Methods in Applied Epidemiology course offered in the School of Population and Public Health at the University of British Columbia (UBC). These videos are created as part of #marinstatslectures video tutorial series to support some courses at UBC (#IntroductoryStatistics and #RVideoTutorials for Health Science Research), although we make all videos available to the everyone everywhere for free.
Thanks for watching! Have fun and remember that statistics is almost as beautiful as a unicorn!
 0:08:48
StatQuest: Logistic Regression
 0:14:22
Logistic Regression [Simply explained]
 0:03:48
Logistic Regression in 3 Minutes
 0:20:12
Logistic Regression I | Statistics for Applied Epidemiology | Tutorial 5
 0:10:01
Lec-5: Logistic Regression with Simplest & Easiest Example | Machine Learning
 0:05:04
Linear Regression vs Logistic Regression - What's The Difference?
 0:09:38
Regression Analysis: An introduction to Linear and Logistic Regression
 0:09:14
Logistic Regression - THE MATH YOU SHOULD KNOW!
 0:40:25
Learn Statistical Regression in 40 mins! My best video ever. Legit.
 0:17:34
Logistic Regression Simply Explained with Examples
 0:08:02
1. Logistic Regression | Logistic Regression Solved Numerical Example Machine Learning Mahesh Huddar
 0:11:46
Logistic Regression Explained in Hindi
 0:00:38
Logistic Regression CLASSIFIER has REGRESSION in its name? #InterviewQuestions #AVshorts
 0:19:02
Logistic Regression Details Pt1: Coefficients
 0:02:48
Logistic regression in Stata®, part 1: Binary predictors
 0:06:50
Logistic Regression: An Introduction
 0:12:40
Tutorial 35- Logistic Regression Indepth Intuition- Part 1| Data Science
 0:20:25
Logistic regression : the basics - simply explained
 0:12:15
Performing Logistic Regression in SPSS
 0:01:00
Linear Regression vs. Logistic Regression [in 60 sec.] #shorts
 0:00:55
Logistic regression is a classification algorithm #shorts
 0:10:23
Logistic Regression Details Pt 2: Maximum Likelihood
 0:02:34
Linear Regression in 2 minutes
 0:08:40
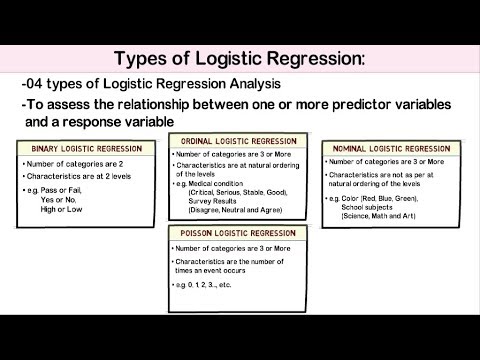
Logistic Regression Analysis: Introduction, Types and Data Considerations
Комментарии