filmov
tv
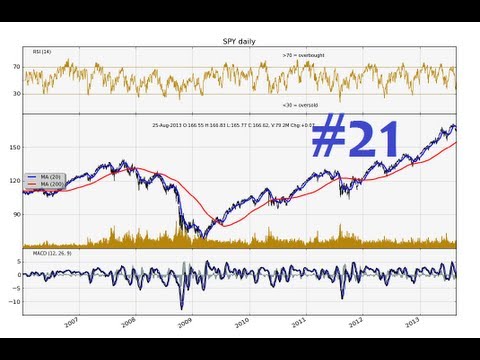
Charting Stocks and Forex Part 21 - How to calculate exponential moving average in python

Показать описание
This is the twenty-first video in the series for stock price analysis, teaching you how to calculate an
exponential moving average in python. The purpose of the videos in this series is to teach you how to
program your own charting and technical analysis of stocks or Forex.
This is beneficial for you if you plan to do any sort of algorithmic, high-frequency, or any sort of
automated trading.
exponential moving average in python. The purpose of the videos in this series is to teach you how to
program your own charting and technical analysis of stocks or Forex.
This is beneficial for you if you plan to do any sort of algorithmic, high-frequency, or any sort of
automated trading.
 0:07:10
Charting Stocks and Forex Part 22 - How to calculate MACD in python
 0:08:47
Charting Stocks and Forex Part 23 - How to add MACD to matplotlib graph
 0:00:07
Candlestick Entry #chartpatterns | Stock #market | Price Action I Forex | Crypto Technical Analysis
 0:05:52
Charting Stocks and Forex Part 21 - How to calculate exponential moving average in python
 0:11:45
The ONLY Candlestick Pattern Guide You'll EVER NEED
 0:00:06
Candle Patterns Representation @ChartPatterns #trading #forex #crypto
 0:07:16
Charting Stocks/Forex for Technical Analysis Part 13 - Changing candlestick shadow color matplotlib
 0:10:11
Charting Stocks/Forex for Technical Analysis Part 11 - Candlestick and Volume Chart in Matplotlib
 0:00:19
inverse fair value gap📈💲#trading #stockmarket #forex #viralvideo
 0:07:03
Charting Stocks and Forex Part 24 - Enhancing our RSI on our matplotlib stock graph
 0:00:13
How To Analysis Pattern #trading #forex #daytrading #forexstrategy
 1:17:35
The Only Technical Analysis Video You Will Ever Need... (Full Course: Beginner To Advanced)
 0:00:21
Easy Way To Trade Forex [Beginner Guide]
 0:01:00
Candlestick Charts: Explained in 60 Seconds!
 0:00:10
Best trading indicator 📈 #stocks #crypto #forex #tradingview
 0:16:11
Charting Stocks/Forex for Technical Analysis Part 12 - Customizing Matplotlib Chart
 0:16:06
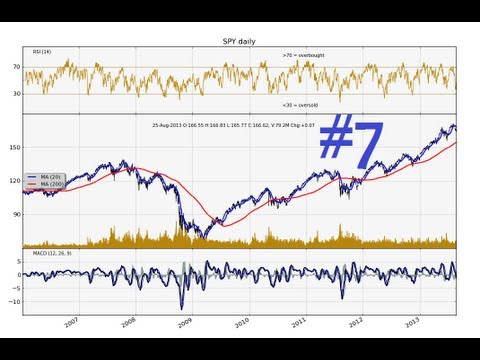
Python Charting Stocks/Forex for Technical Analysis Part 7 - Basic Financial Graph
 0:07:31
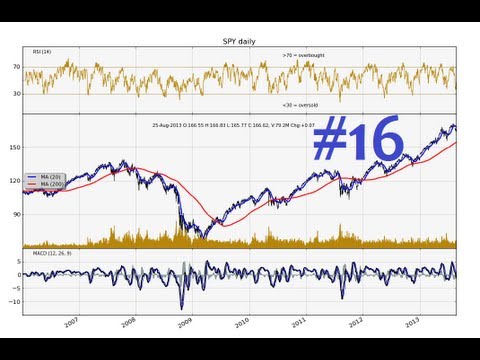
Charting Stocks/Forex for Technical Analysis Part 16 - How to add SMA to matplotlib stock chart
 0:12:46
Charting Stocks and Forex in python Part 17 - Overlay a stock's volume in matplotlib
 0:06:42
How to Read & Understand a Forex Chart! (For Beginner Forex Traders)
 0:12:26
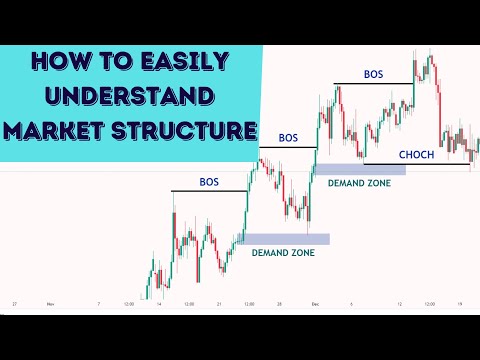
How To EASILY Understand Market Structure | FOREX | SMC
 0:05:42
Python Charting Stocks/Forex for Technical Analysis Part 6 - Basic Financial Graph
 0:00:58
How to Draw Trend lines. Forex, Stocks, Crypto Strategy #shorts
 0:00:20
Simple Price Action Trading strategies ✅ breakout perfect entry #forex #crypto #trading #trending
Комментарии