filmov
tv
1: Salesforce Reports in Lightning Experience | How to Create Reports In Salesforce

Показать описание
🔥 Master Salesforce Reports in Lightning Experience! 🔥
Want to analyze data effectively in Salesforce? In this step-by-step tutorial, you’ll learn how to build reports in Salesforce Lightning Experience from scratch.
📌 In this video, we’ll cover:
✅ How to create a report in Salesforce
✅ How to apply filters to refine data
✅ How to group and summarize report data
✅ How to add charts for better data visualization
💡 Problem Statement:
Imagine you're a sales analyst at EduPro Academy, and you need to track student enrollments, revenue, and instructor performance. We’ll create a Course Enrollment Report to gain insights into revenue and course popularity.
👨💻 Topics Covered:
🔹 Creating a Report in Salesforce
🔹 Adding & Removing Columns
🔹 Grouping & Summarizing Data
🔹 Applying Filters for Better Insights
🔹 Adding Charts for Visual Representation
📊 Bonus Challenge for You!
📝 Your manager at EduPro Academy wants a report on Total Revenue per Instructor for the last 6 months. Can you build it? Try it and comment below!
🔹 Challenge Instructions:
✔ Report Type: Course Enrollment
✔ Filters: Completed & Paid Enrollments (Last 6 Months)
✔ Group By: Instructor Name
✔ Summary: SUM of Course Fee
✔ Chart: Bar Chart - Instructor vs Revenue
✔ Save As: Instructor Revenue Analysis
🚀 Like, Share & Subscribe for more Salesforce tutorials!
🔔 Turn on notifications to stay updated on new videos.
💬 Have questions? Drop them in the comments!
📌 **Timestamps:**
0:00 - Introduction to Salesforce Reporting
0:16 - Why is reporting important?
0:28 - What you will learn in this video
0:37 - Problem Statement: EduPro Academy Scenario
1:11 - Custom Object & Fields Overview
1:24 - Important Tip: Enable "Allow Reports"
1:31 - Step 1: Creating a Report
1:38 - Navigating to the Reports Tab
1:46 - Creating a New Report
1:53 - Selecting the Report Type
2:00 - Step 2: Adding & Removing Columns
2:04 - Keeping the Report Clean & Focused
2:10 - Adding Key Fields (Student Name, Course Name, Instructor Name, Course Fee, Payment Status)
2:49 - Removing Unnecessary Columns
2:58 - Step 3: Grouping & Summarizing Data
3:07 - Grouping Data by Course Name
3:14 - Summarizing Data: Calculating Total Revenue per Course
3:28 - Step 4: Applying Filters
3:32 - Accessing the Filters Panel
3:53 - Applying Filters (Status: Completed, Payment Status: Paid)
4:11 - Filtering by Enrollment Date (Last 6 Months)
4:56 - Adding Enrollment Date to the Report Columns
5:04 - Reviewing Filtered Data
5:14 - Step 5: Adding a Chart for Visualization
5:21 - Selecting a Chart Type (Bar Chart: Course Name vs Revenue)
5:33 - Customizing the Chart
6:03 - Understanding Course Revenue Insights
6:12 - Saving & Running the Report
6:36 - Summary & Final Thoughts
6:43 - Bonus Challenge: Instructor Revenue Analysis Report
7:10 - Encouragement to Experiment with Filters & Groups
7:22 - Call-to-Action: Like, Subscribe & Stay Tuned for More!
7:33 - Thank You & See You in the Next Video 🚀
#Salesforce #SalesforceReports #LightningExperience #SalesforceTutorial #CRM #BusinessIntelligence #SalesforceAdmin #SalesforceTraining
 0:07:37
1: Salesforce Reports in Lightning Experience | How to Create Reports In Salesforce
 0:18:18
Salesforce Reports and Dashboard in Lightning Session 1
 0:06:11
10 Advanced Salesforce Reporting Features You Need to Know!
 0:12:30
Create Reports Salesforce Lightning | Full Tutorial | 2022
 0:03:50
How to Build a Report in Lightning Experience | Salesforce
 0:04:59
How to Build a Dashboard in Lightning Experience | Salesforce
 0:06:40
Use Custom Report Types to Build Powerful Salesforce Reports
 0:05:48
How to Use Row Level Formulas in Salesforce Reports
 0:28:36
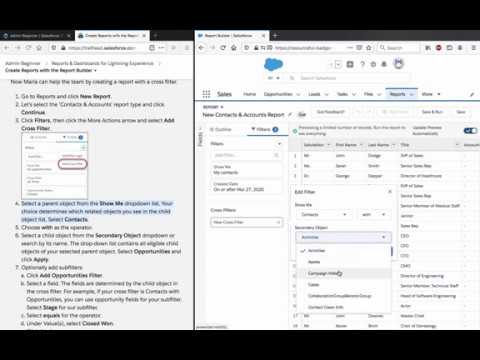
Create Reports with the Report Builder in Salesforce
 0:07:33
Salesforce Trailhead - Introduction to Reports and Dashboards in Lightning Experience
 0:40:48
Lightning Dashboards Top Tips & Tricks | Salesforce
 1:27:52
Reports & Dashboards | Custom Report Types | Share and Schedule | Ep 12
 0:16:21
Salesforce Dashboards Demo in Lightning Session 4
 0:15:21
How to create joined reports in Salesforce Classic & Lightning
 0:29:09
Master the New Lightning Report Builder
 0:07:18
Salesforce Reports and Dashboards: Everything to Know
 0:03:09
How to Run a Report in Salesforce - Lightning
 0:09:34
Learn How To Build Salesforce Lightning Report Using Report Builder
 0:02:53
Subscribe to Reports and Dashboards (Lightning Experience) | Salesforce
 0:15:10
Why and How to Create a Custom Report Type in Salesforce + the 'Power of 1' Trick 😉 #sales...
 0:05:14
How to Use Created Date “Count” in a Report Formula | Salesforce
 0:00:28
How to organize reports into folders in Salesforce Lightning
 0:09:20
01 How to Create Custom Report Types to Create Reports in Salesforce | Salesforce Training Videos
 0:08:39
Joined Reports in Salesforce | How to Create a Joined Report | Salesforce Reporting Series
Комментарии