filmov
tv
A Level Physics: Uncertainty and graphs, line of worst fit

Показать описание
If you have found this video useful, a like and a sub would only be fitting! : )
Revising A Level Physics? Check out my revision videos too:
How can we find the percentage uncertainty of a gradient of a graph using error bars?
Music Credit: Anodised from Microsoft Video Editor
Chapters:
00:00 Line of Best Fit
01:02 Line of Worst Fit
02:50 Uncertainty in the gradient
Revising A Level Physics? Check out my revision videos too:
How can we find the percentage uncertainty of a gradient of a graph using error bars?
Music Credit: Anodised from Microsoft Video Editor
Chapters:
00:00 Line of Best Fit
01:02 Line of Worst Fit
02:50 Uncertainty in the gradient
 0:11:10
A Level Physics Revision: All of Uncertainties (in under 11 minutes!)
 0:21:42
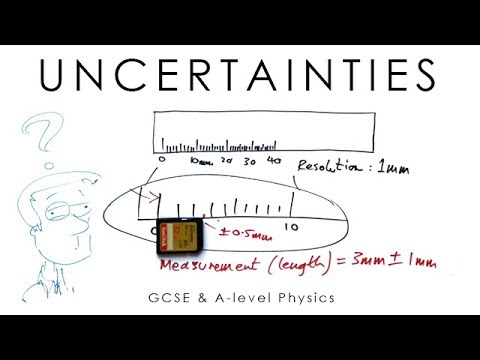
Uncertainties - Physics A-level & GCSE
 0:29:45
All of AQA Measurements and their Errors - A Level Physics REVISION
 0:02:03
Absolute Uncertainties and Percentage Uncertainties | A Level Physics
 0:42:03
A Level Physics Revision: All of Foundations of Physics - Units, Prefixes, Errors, Uncertainties
 0:11:24
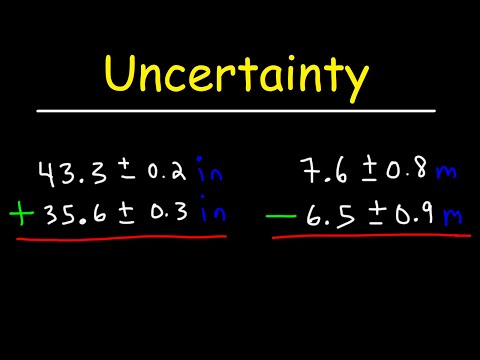
Uncertainty - Addition and Subtraction
 0:08:08
Combining Uncertainties - WORKED EXAMPLE - A Level Physics
 0:08:50
ERRORS & UNCERTAINTIES - GCSE Science & A-level Physics Practical Skills
 0:10:09
RESISTIVITY- A-level Physics Required Practical
 0:03:47
Combining Uncertainties - A Level Physics
 0:19:37
1.2e Uncertainty Identities | AS Physical Quantities | Cambridge A Level Physics
 0:03:21
ON20 P12 Q5 Percentage Uncertainty | Oct/Nov 2020 | Cambridge A Level 9702 Physics
 0:14:18
A Level Physics: Percentage Uncertainty Example Questions
 0:07:28
Combining Uncertainties | A Level Physics
 0:04:33
A Level Physics: Uncertainty and graphs, line of worst fit
 0:03:26
A Level Practical Endorsement - Absolute Uncertainty
 0:10:37
A Level Physics: Systematic and random errors
 0:14:26
Uncertainties: WAAP: Edexcel A-level Physics
 0:26:07
1.2e Examples: Uncertainties and Readings | AS Physical Quantities | Cambridge A Level Physics
 0:08:55
All of PRACTICAL SKILLS in 10 mins - A-level Physics
 0:03:07
GCSE Working Scientifically 'Uncertainty'
 0:00:58
Find the absolute uncertainty in resistivity
 0:22:44
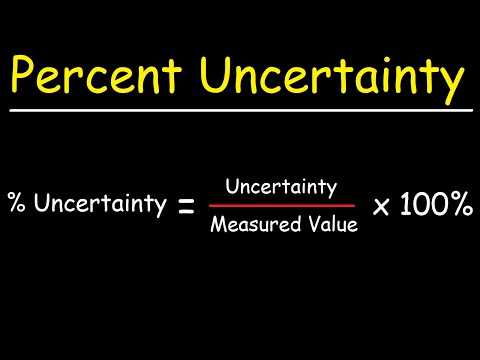
Percent Uncertainty In Measurement
 0:04:54
A Level Practical Endorsement - Percentage Uncertainty in a Gradient
Комментарии