filmov
tv
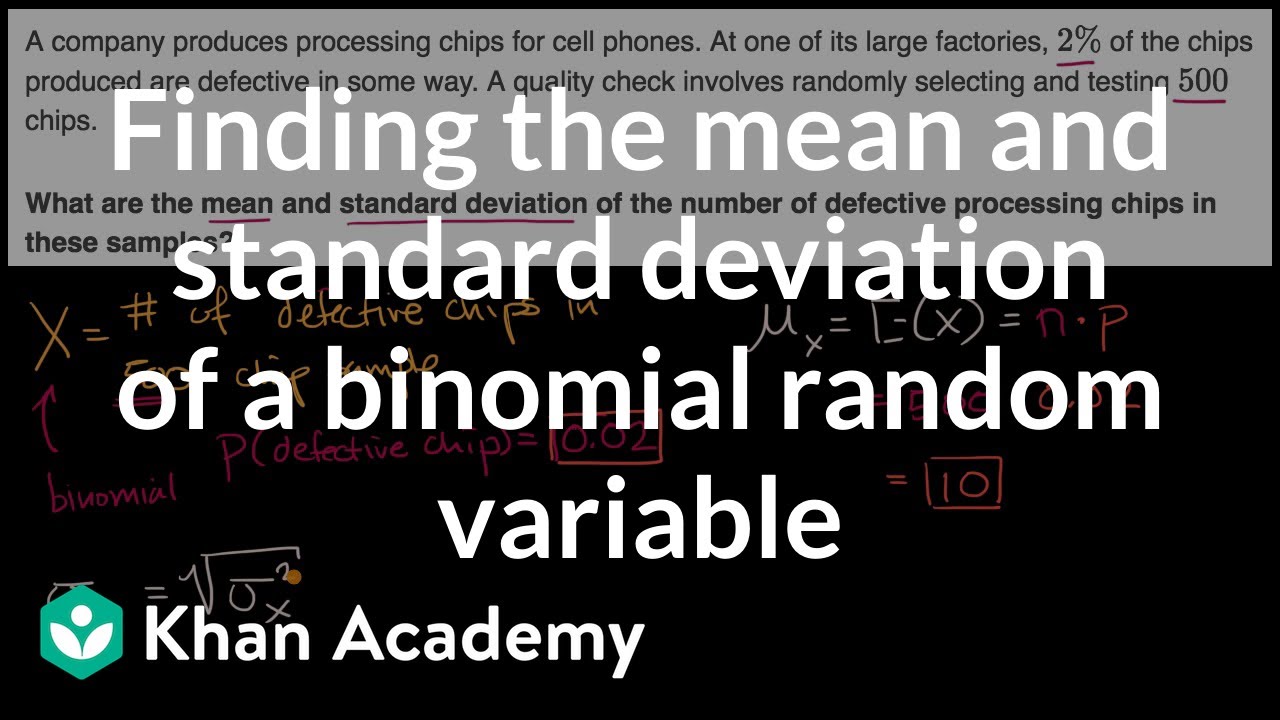
Finding the mean and standard deviation of a binomial random variable | AP Statistics | Khan Academy
Показать описание
Example showing how to find the mean and standard deviation of a binomial random variable.
AP Statistics on Khan Academy: Meet one of our writers for AP¨_ Statistics, Jeff. A former high school teacher for 10 years in Kalamazoo, Michigan, Jeff taught Algebra 1, Geometry, Algebra 2, Introductory Statistics, and AP¨_ Statistics. Today he's hard at work creating new exercises and articles for AP¨_ Statistics.
Khan Academy is a nonprofit organization with the mission of providing a free, world-class education for anyone, anywhere. We offer quizzes, questions, instructional videos, and articles on a range of academic subjects, including math, biology, chemistry, physics, history, economics, finance, grammar, preschool learning, and more. We provide teachers with tools and data so they can help their students develop the skills, habits, and mindsets for success in school and beyond. Khan Academy has been translated into dozens of languages, and 15 million people around the globe learn on Khan Academy every month. As a 501(c)(3) nonprofit organization, we would love your help! Donate or volunteer today!
 0:12:12
How to find the mean, median, mode, standard deviation and variance.
 0:00:45
SPSS - Mean, Median, Mode, Standard Deviation & Range
 0:06:46
Unknown Mean and Standard Deviation - Normal Distribution
 0:08:05
Normal Distribution - Finding Mean and Standard Deviation Normal Distribution [Year 2 Maths (Stats)]
 0:07:10
Mode, Median, Mean, Range, and Standard Deviation (1.3)
 0:05:02
Finding the mean and standard deviation of a binomial random variable | AP Statistics | Khan Academy
 0:06:28
AQA Mathematical Studies 2A: The Normal Distribution 11b: Finding the Mean μ - Calculator
 0:05:52
Calculate Mean Median Mode and Standard Deviation in Excel
 0:24:24
Edexcel A Level Maths: 3.5 Finding the Mean and Standard Deviation for a Normal Distribution
 0:10:05
Can You Find Mean, Variance, & Standard Deviation of a Frequency Grouped DataTable? Simple Tuto...
 0:10:21
Standard Deviation Formula, Statistics, Variance, Sample and Population Mean
 0:11:27
Find the Mean, Variance, & Standard Deviation of Frequency Grouped Data Table| Step-by-Step Tuto...
 0:08:26
How to Find the Standard Deviation, Variance, Mean, Mode, and Range for any Data Set
 0:04:08
Find the mean and standard deviation for the set of data {3, 5, 6, 7, 9, 11, 22}. Conceptual
 0:10:38
Find Percentile with Mean and Standard Deviation (Normal Curves) | Statistics
 0:02:44
How to calculate mean and standard deviation in Excel
 0:06:34
Finding Mean and Standard Deviation from a Frequency Table
 0:04:03
Classwiz How-To: Finding the Mean & Standard Deviation from a Grouped Frequency Table
 0:11:07
How to Find the Standard Deviation, Variance, and Mean of a Sample and a Population - Easy Tutorial
 0:07:08
Normal distribution - finding a mean or standard deviation, Part 1, Elementary Statistics in ALEKS
 0:28:15
S1 Mean and Standard deviation - How to Calculate Mean and Standard Deviation or Variance
 0:05:31
MEAN, VARIANCE, AND STANDARD DEVIATION FOR UNGROUPED DATA
 0:11:11
Coding in Statistics (mean and standard deviation)| ExamSolutions
 0:03:45
Calculating Mean, Standard Deviation & Error In Excel
Комментарии