filmov
tv
Data Highlighting in 3D Graphs
Показать описание
Origin 2020b supports highlighting data points in 3D graphs and extracting the selected data to a new worksheet. Previously, this feature was only available for 2D graphs.
OriginLab Corp.
OriginLab
OriginPro
Origin software
Data highlighting
Highlight data in 3d graph
Рекомендации по теме
0:00:28
Data Highlighting in 3D Graphs
0:04:36
3D graph plotting in Origin
0:01:01
3D surface color graph in origin
0:08:43
Highlight the High and Low Points of a Chart in Excel
0:04:26
How to highlight some potion of graph in origin pro
0:17:24
Professional 3D Plotting in Matplotlib
0:00:47
Graphing XYZ Lat long and Alt in a Excel 3D scatter plot - XYZ Mesh EXAMPLE
0:00:42
Merge 2D and 3D Graphs into one Window
1:42:36
Day 3 (20 July 2024): Advanced Plotting and Visualization
0:12:22
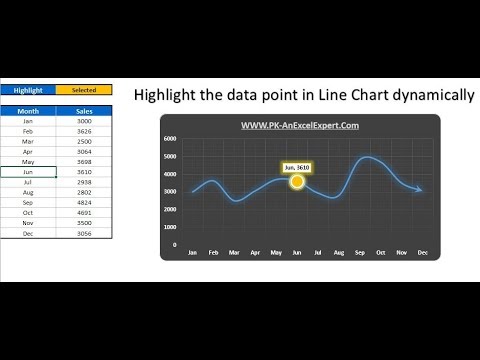
Highlight the Specific data point in a Line Chart Dynamically
0:04:02
Graphing: Origin: Contour Plots and Color Mapping Part 3 - Create Contour Plot from XYZ Data
0:07:46
Plotting a 3D graph for XRD data
0:22:03
How to Create Dynamic and Interactive Infographic 3D Stacked Bar Chart in Microsoft Excel
0:01:21
How to plot a simple 3D graph in origin
0:00:59
Google Data Studio chart highlighter - The result
0:07:57
Dynamically Highlight Topper Student on the Chart in Excel
0:02:13
Mastering Matplotlib 3 : Plotting with 3D Axes | packtpub.com
0:09:01
Create an Interactive Line Graph with a Hover Dual Line Highlight using VX and D3
0:07:16
Manim Tutorial | 3D Graphing | Tutorial 4, Manim Explained
0:01:31
How to Make a Graph Change Color Based on Value | Conditionally Formatting Charts
0:09:24
Presenting Data-Highlighting A Single Number: Pie or Donut Graph
0:03:39
How to plot 3D Bar graphs using Sigmaplot
0:00:31
Bar Graph Highlighting in Blender! [Node Charts - October 2023 Update Trailer]
0:05:47
How to draw 3D graphs | Origin 9 - Tutorial | Basics - 14 |

 0:00:28
 0:04:36
 0:01:01
 0:08:43
 0:04:26
 0:17:24
 0:00:47
 0:00:42
 1:42:36
 0:12:22
 0:04:02
 0:07:46
 0:22:03
 0:01:21
 0:00:59
 0:07:57
 0:02:13
 0:09:01
 0:07:16
 0:01:31
 0:09:24
 0:03:39
 0:00:31
 0:05:47