filmov
tv
Create One Pivot Table from Many Sheets ~ AWESOME Excel Trick

Показать описание
Ever wanted to make a pivot table, but your data is scattered across multiple worksheets? Like Jan, Feb, Mar...?
In this video, learn an AMAZING Excel trick to solve the problem easily.
Note: This works in Excel 2016 or above (or with Power Query add-in in Excel 2013)
⏱ Video Topics:
==============
0:00 - Many sheets, One Pivot - the problem
0:42 - Combining the data (using Power Query)
2:08 - Data cleansing with Power Query
4:00 - Creating the pivots
6:00 - How to add new data and update the pivots
7:00 - What if your data is not structured correctly?
📁sample data
=============
Try it yourself using the sample dataset here 👇
📺 Watch next
=============
How to combine data when the headers / structure is not matching?
Combine multiple sheets of data using Power Query
Have data in a folder instead? Use this method:
How to create Pivot Tables? (8 examples):
Full Advanced Excel Course by Chandoo:
📗💻 LEARN EXCEL - FULL COURSE by Chandoo
========================================
Want to learn how to use Excel for Data Analysis, MIS, Reporting or Project Management roles? Check out my Excel School program and sign-up today.
~
#excel #dataanalytics
 0:11:02
Create a Pivot Table from Multiple Sheets in Excel | Comprehensive Tutorial!
 0:07:34
Create One Pivot Table from Many Sheets ~ AWESOME Excel Trick
 0:12:35
Make Pivot Table from Multiple Sheets in Excel
 0:09:06
Consolidate & Clean Multiple Excel Sheets in One Pivot Table
 0:04:56
Create a PivotTable in Excel using multiple worksheets by Chris Menard
 0:10:31
Create Excel Pivot Table from Multiple Sheets: The FASTEST Way
 0:01:58
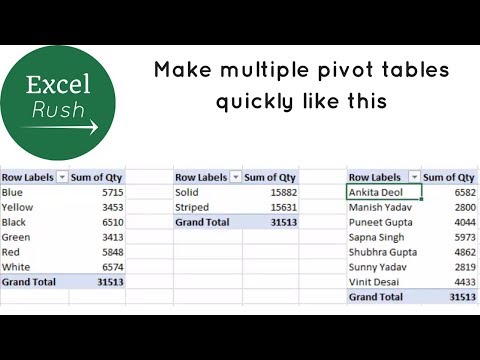
How to duplicate or make copies of your pivot table. Make multiple pivot tables quickly.
 0:20:49
How to Create Pivot Table in Excel
 0:00:58
How to Create Multiple Sheets in One Click | Excel Magic! | Pivot Table | #exceltips #excel #shorts
 0:04:35
How to create a pivot table from multiple sheets of data
 0:07:47
Make Pivot Tables from more than one source data table with this simple trick
 0:10:40
Advanced Pivot Table Techniques: Combine Data from Multiple Sheets in Excel
 0:05:10
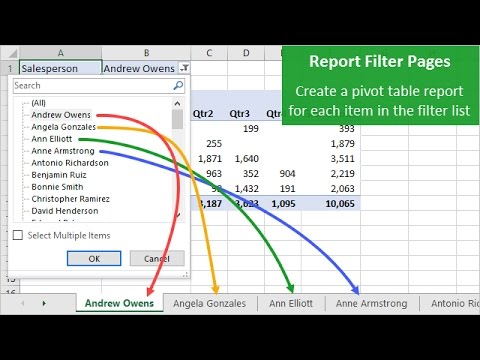
📈Create Pivot Table Report Filter Pages
 0:04:17
Excel 2013/2016: Create a Pivot Table From Multiple Tables
 0:06:33
Use Power Query to Create Pivot Table from Multiple Sheets
 0:04:01
Create Multiple Reports in a PivotTable
 0:10:00
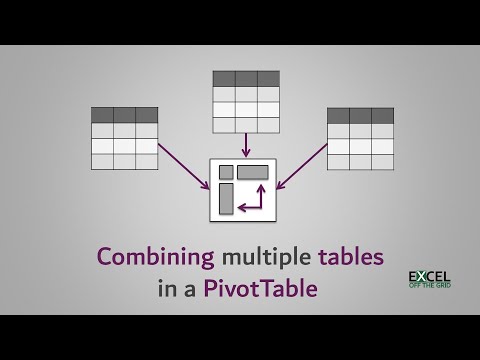
Join multiple tables in a PivotTable
 0:12:08
How to Create a PivotTable From MULTPLE SHEETS in Excel (Different Headers or With the Same Headers)
 0:06:08
Create Multiple Pivot Table Reports with Show Report Filter Pages
 0:15:01
Pivot Table from Multiple Sheets - Google Sheets
 0:06:43
How To Create A Pivot Table From Multiple Worksheets
 0:13:36
Pivot Table Excel Tutorial
 0:04:36
Merging Multiple Pivot Tables In Excel #myexcelmaster
 0:06:37
I don't use PIVOT tables anymore... I use this other thing instead!
Комментарии