filmov
tv
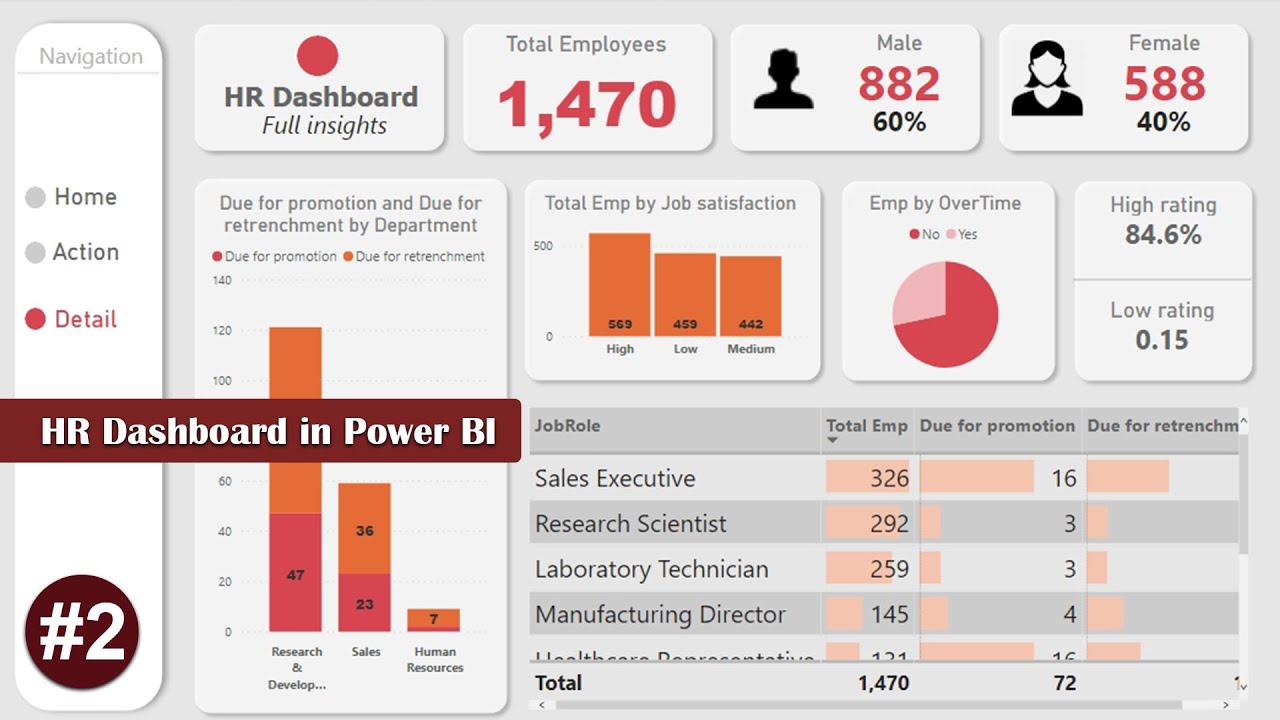
POWER BI Tutorial From BEGINNER to Pro Level - HR Power BI report - Power BI Desktop
Показать описание
Power BI video tutorial from beginner to advanced level. This is a Power BI video tutorial from a beginner to a professional level using Power BI Desktop.
This power BI tutorial will take you to the Power Query environment where we can have our data transformed and then load it to the Power BI module for further analysis and perfect visualization.
In this Power BI Video tutorial, we will create HR using a report/dashboard with very dirty and rough data we got in CSV. Power Query will help you make the data clean and easy to use for analysis.
Power BI will help you create advance reports and dashboards. To create interactive and advanced reports and dashboards.
Subscribe and turn on the Bell icon for quick notification every time I drop a new video.
To master Microsoft Excel Dashboard and Data Analytics, using Excel subscribe, go to the home page of this channel to find 100s
of our videos on Excel Dashboards.
TO SUPPORT this YOUTUBE CHANEL, you can reach out to us here via WhatsApp at +234 810 6090 365 With your supports we can create more quality videos.
I can help you create your Business dashboard or any form of the dashboard with Excel or Power BI.
Get colors for your dashboard design:
Watch other Excel animated dashboards
I teach this Excel Dashboard Fully Free!
Some Amazing Free Excel Dashboards for you, keep watching!
Making a Dynamic Dashboard in EXCEL excel VBA dashboard excel dashboard example
Excel Dashboard with a Search Bar
Excel Dashboard you have never seen or created before
Smart Excel Function Tricks for Business
Excel Dynamic Dashboard for Business
Excel Dashboards and workbooks with secured login
Awesome Visual Excel Dashboard
Excel Dashboard School
Free Sales Excel Dashboard
On this Youtube channel, we create beautiful excel dashboard templates, all our modern excel dashboard designs will best suit your personal use or aid your company in times of analytics.
we have used a little VBA to garnish some part of our dashboard to make it stand out from the rest of the excel dashboard you had ever seen on YouTube.
This dashboard is an EXCEL DASHBOARD EXAMPLE or An excel CHANNEL for Dashboard Inspirations.
To create dynamic Inventory management or store management in excel (No VBA)
#makingadynamicdashboardinexcel
#vba #excelvba #datawithdecision #pivotTable #excel #msexcel #exceldashboard #excelpivottable #excel
#exceldashboard
 0:12:32
Power BI Tutorial for Beginners
 0:23:03
Power BI Tutorial For Beginners | Create Your First Dashboard Now (Practice Files included)
 3:02:18
Hands-On Power BI Tutorial 📊 Beginner to Pro [Full Course] 2023 Edition⚡
 0:27:53
How to use Microsoft Power BI - Tutorial for Beginners
 6:48:33
🔥Power BI Full Course 2024 | Power BI Tutorial for Beginners | Simplilearn
 1:03:31
Power BI Tutorial From Beginner to Pro ⚡ Desktop to Dashboard in 60 Minutes ⏰
 3:35:38
Power BI Full Course - Learn Power BI in 4 Hours | Power BI Tutorial for Beginners | Edureka
 0:42:40
Power BI Tutorial For Beginner | Create Your First Dashboard!
 8:36:05
Power BI Full Course in 8 Hours | Power BI Tutorial for Beginners | @PavanLalwani
 1:36:48
Power BI Beginner Tutorial
 0:44:59
Power Bi tutorial for Beginners | Power BI Dashboard Project in Hindi | Power Bi Course 2023
 0:06:47
1.1 Power BI Tutorial for Beginners (Introduction to Power BI )
 1:19:28
POWER BI Tutorial From BEGINNER to Pro Level - HR Power BI report - Power BI Desktop
 0:25:57
Power BI Tutorial für Anfänger in 25 Minuten! (Deutsch / German)
 0:09:07
Should You Learn Power Bi? Everything You Need To Know
 0:14:27
Les BASES De Power BI Pour Débutant
 11:36:20
Power BI Full Course 2024 | Power BI Tutorial For Beginners | Power BI Course | Intellipaat
 0:17:10
What Is Power BI? | Introduction To Power BI | Power BI Tutorial For Beginners | Simplilearn
 1:17:39
Power BI Basics Full Course for Beginners in Tamil |Training Attendance Status in Power BI Dashboard
 0:41:07
How to Build Power BI Reports from Start to Finish
 8:20:12
Power BI Full Course Tutorial (8+ Hours)
 3:05:45
Hands-On Power BI Tutorial 📊Beginner to Pro [Full Course] ⚡
 0:42:50
Beginner to PRO Data Analysis with Power BI - Full Length Course (with sample files!)
 11:25:42
Microsoft Power BI Tutorial For Beginners✨ | Power BI Full Course 2023 | Learn Power BI
Комментарии