filmov
tv
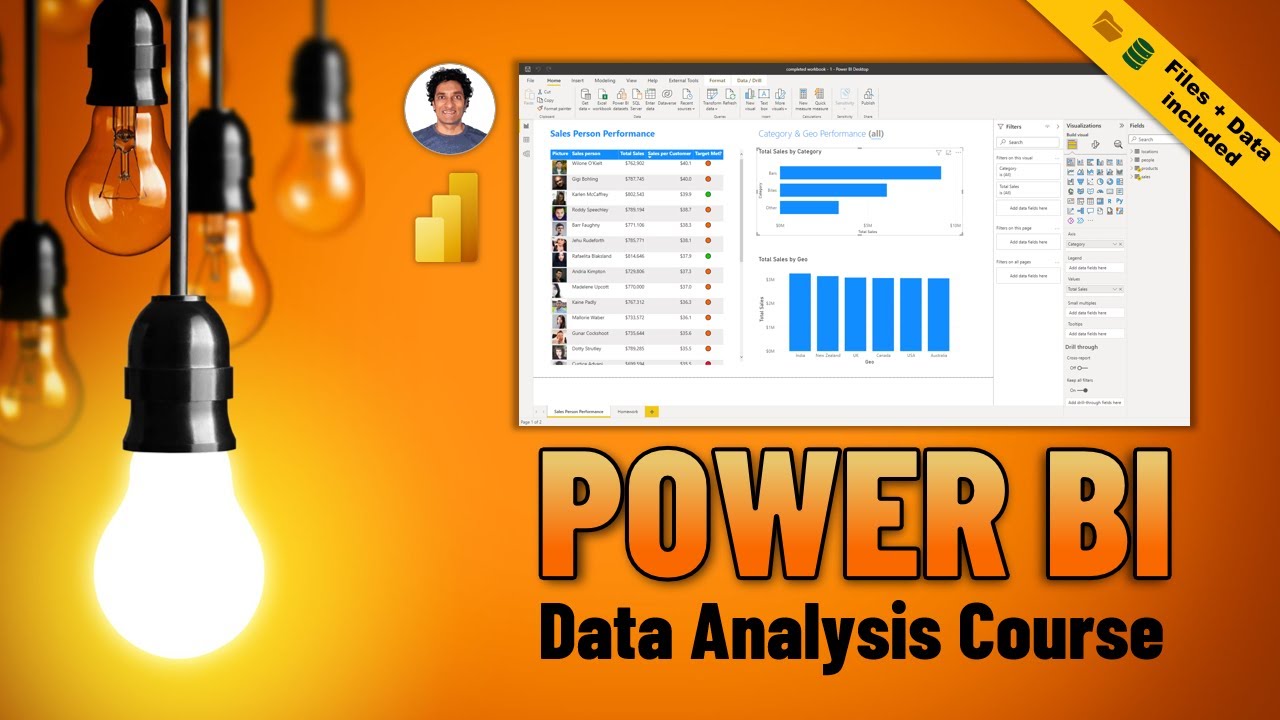
Beginner to PRO Data Analysis with Power BI - Full Length Course (with sample files!)
Показать описание
You asked for it. Here is a complete and in-depth course on how to use Power BI for data analysis. We are going to cover powerful & practical concepts like,
✅ How to load and clean-up data with Power BI
✅ How to build a data model in Power BI
✅ Using DAX & Power Pivot to build measures and calculations
✅ Creating and changing visuals
✅ Answering business questions with Power BI
✅ Understanding trends & creating forecast in Power BI
✅ Customizing visuals & interaction effects
✅ Creating a comprehensive sales performance report
✅ Saving and publishing the Power BI files
✅ Updating and data refresh process
✅ Additional resources to learn and master Power BI
~
DOWNLOAD THE FILES:
====================
👉 If you want to follow-along:
👋If you want completed files:
POWER BI LEARNING RESOURCES:
=============================
~
VIDEO TIMESTAMPS ⏱👉
======================
Use these timestamps to access individual chapters of the video. For best results, watch the video from start to finish.
0:00 - Welcome to Data Analysis with Power BI Course
1:50 - Power BI Desktop (how to get it)
2:50 - Power BI Desktop Screen Explained
4:42 - Sample Data file explained
5:58 - Loading data into Power BI
7:24 - Setting up the data model in Power BI (star schema)
9:30 - Creating our first charts in Power BI
10:38 - Fixing data problems (data clean-up with Power Query)
13:16 - Adding "amount by sales persons / team" chart
13:53 - Interactive nature of Power BI
15:21 - Fixing "blank" team problem
16:33 - Saving Power BI workbooks
16:48 - Analyzing Sales Peron Performance in Power BI
17:52 - Adding "Measures" with DAX in Power BI
20:06 - Using Slicers to filter visual / page level data
20:41 - Formatting the visuals
22:22 - Adding more "measures"
25:00 - How to setup conditional formatting on the visuals
26:32 - Adding "WOW" factor to the report
28:11 - More visuals & controlling the interactions
31:04 - Adding "titles & logos" on the report
33:01 - How to do "trend analysis" in Power BI
36:02 - Forecasting Power BI
37:44 - How to save & publish Power BI reports
39:45 - Refreshing with new data
41:10 - How to learn more about Power BI?
1 Page PDF on Learning Power BI 📃💻👇
==================================
More Power BI related Videos for you 👉
=================================
~
Thank you and happy learning. 😀🌞🌻
#PowerBI #Data
 0:42:50
Beginner to PRO Data Analysis with Power BI - Full Length Course (with sample files!)
 0:49:16
Beginner to Pro FREE Excel Data Analysis Course
 0:10:55
FASTEST Way to Become a Data Analyst and ACTUALLY Get a Job
 0:10:20
A Beginners Guide To The Data Analysis Process
 0:36:04
Beginner to PRO Data Analysis with Excel - FREE Adv. Masterclass in TELUGU
 3:02:18
Hands-On Power BI Tutorial 📊 Beginner to Pro [Full Course] ⚡
 0:10:59
How I Would Learn Data Analysis (If I Could Start Over)
 1:53:40
Introduction to Data Analysis with Excel: 2-Hour Training Tutorial
 0:02:11
Learn Power BI | Beginners to Pro | Day 39 Case Study | HR Analytics in Power BI
 0:08:13
Excel AI - data analysis made easy
 5:13:47
Data Analytics FULL Course for Beginners to Pro in 29 HOURS - 2024 Edition
 1:03:31
Power BI Tutorial From Beginner to Pro ⚡ Desktop to Dashboard in 60 Minutes ⏰
 0:08:16
I started my data analyst career taking these beginner courses
 0:09:04
What Is Data Analytics? - An Introduction (Full Guide)
 0:14:08
How I'd Learn Data Analytics in 2024 (If I Had to Start Over)
 0:12:30
How I Would Learn to be a Data Analyst
 0:10:04
Excel Data Analysis - From Beginner to Pro with Descriptive Statistics
 0:12:32
Power BI Tutorial for Beginners
 0:11:15
Your first 10 minutes of Power BI - A no-nonsense getting started tutorial for beginners
 0:23:03
Power BI Tutorial For Beginners | Create Your First Dashboard Now (Practice Files included)
 1:17:35
The Only Technical Analysis Video You Will Ever Need... (Full Course: Beginner To Advanced)
 0:08:00
Free Excel courses for beginner data analyst
 10:17:11
Data Analytics Full Course 2022 | Data Analytics For Beginners | Data Analytics Course | Simplilearn
 0:27:53
How to use Microsoft Power BI - Tutorial for Beginners
Комментарии