filmov
tv
Quartiles, the 5-Number Summary, and Box-and-Whisker Plots
Показать описание
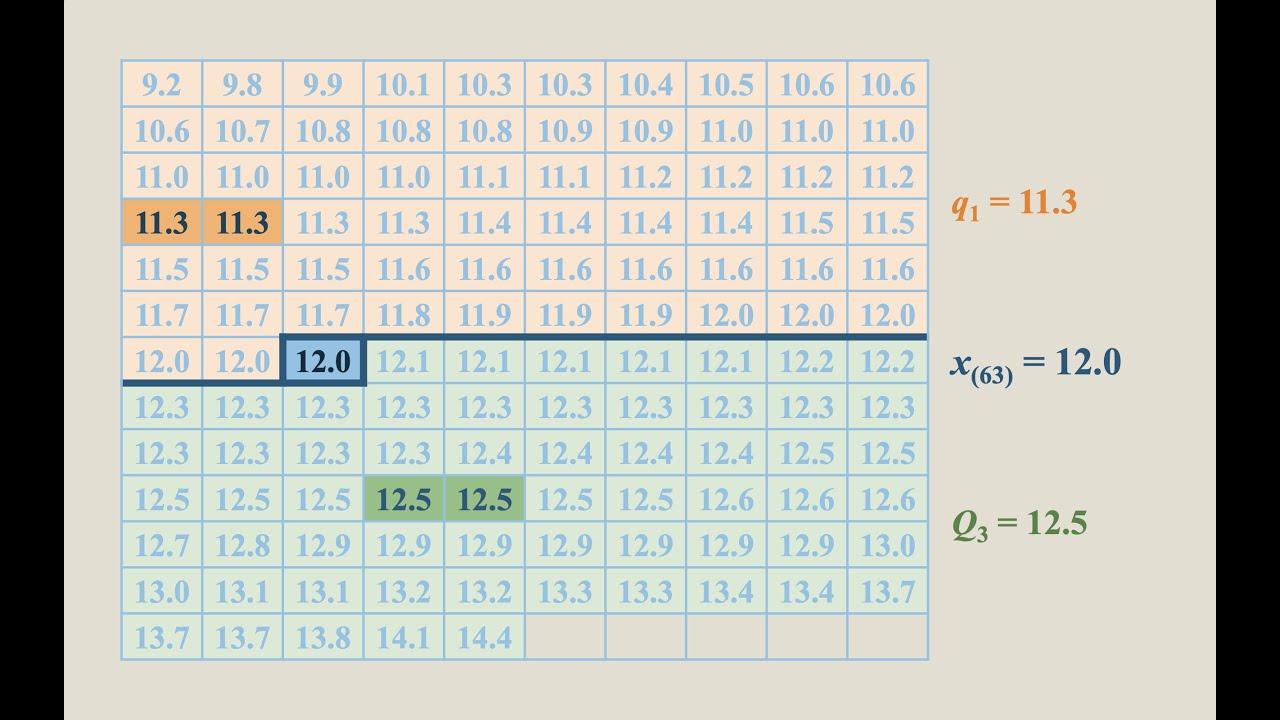
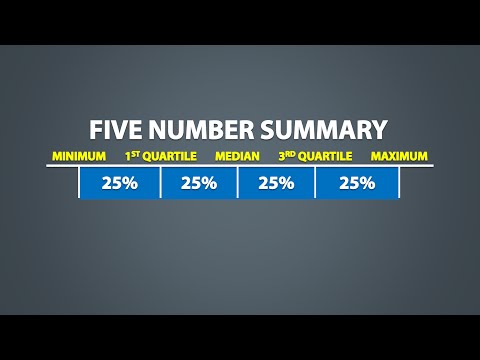
In this brief video, we introduce the concept of the quartiles for a data set. We provide two protocols to locate these values: the first is the by-hand method of locating the median for the upper- and lower-halves of the data, and the second is using percentiles and the L-locator method. After defining the quartiles and providing a means of calculating them by-hand, we introduce the 5-number summary: minimum, maximum, median & quartiles. Finally, we show how to use these five numbers to construct the box-&-whisker plot (also just called a boxplot) for a data set. We also elaborate on how the boxplot can be used to interpret the density of data in the intervals indicated by the boxplot.
 0:03:24
 0:10:14
 0:10:54
 0:05:37
 0:13:28
 0:04:55
 0:00:58
 0:11:46
 0:06:25
 0:13:02
 0:13:24
 0:01:54
 0:19:44
 0:05:04
 0:20:21
 0:04:32
 0:04:55
 0:04:30
 0:03:31
 0:04:20
 0:18:44
 0:08:42
 0:07:05
 0:08:28