filmov
tv
Plot Circles using the Parametric Equation and Python Matplotlib

Показать описание
As part of a series on Python list operations, plotting and drawing, this NCLab video demonstrates how to plot circles using the parametric equation of a circle and the Python library, Matplotlib. These principles can be used to graph any parametric equation. A companion video shows a similar procedure using a Python turtle drawing tool.
 0:04:10
Plot Circles using the Parametric Equation and Python Matplotlib
 0:06:03
Plot Circles from the Parametric Equation (Python Turtle)
 0:08:20
Creating a circle using parametric equation in Matlab
 0:01:00
Parametric Equations Of Circle in FluidMath
 0:06:44
Using parametric equations to graph circles.
 0:33:29
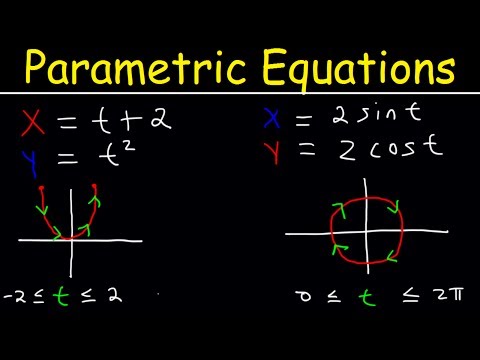
Parametric Equations Introduction, Eliminating The Paremeter t, Graphing Plane Curves, Precalculus
 0:02:24
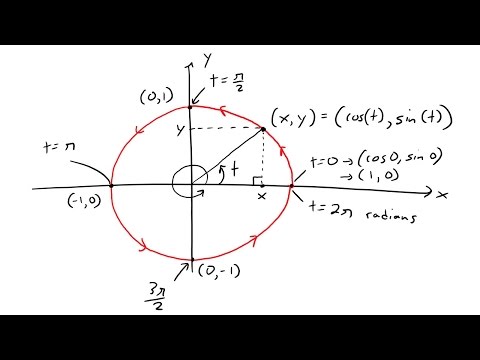
Introduction to Parametric Circle
 0:08:07
Geogebra:Circle with Parametric equation | Basics [TUTORIAL]
 0:18:30
Line Charts in Jetpack Compose Using Bézier Curves and Canvas | Android
 0:03:33
Parametric Circle Graph Example
 0:07:37
Parametric Curves: Example 2: Unit Circle
 0:06:32
Convert Circle / Ellipse Equation into Parametric Equations
 0:08:17
Parametric equ. Graphing a circle, finding Cartesian equ
 0:11:43
Curvature and Osculating Circle for a 2D Parametric Curve in GeoGebra
 0:03:24
Circle Parametric Equation
 0:11:14
Determine Which Parametric Equations Given Would Give the Graph of the Entire Unit Circle
 0:00:19
The Beauty of Parametric Equations! #maths
 0:04:59
Parametric curves Parameterization of a circle with example
 0:00:26
Magic of Circle with it's Parametric Equations 😱😱
 0:06:10
Video 2051.10 - Parametric Equations, circle, ellipse
 0:10:04
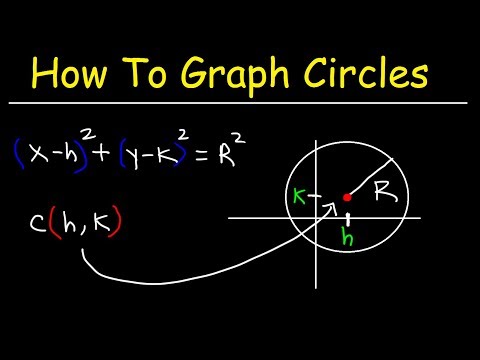
Graphing Circles and Writing Equations of Circles In Standard Form - Conic Sections
 0:08:18
Parametric Curves: Example 3: Unit Circle
 0:11:50
Plotting Math Functions Using Geometry Nodes | Part 2 | Parametric & Polar Expressions
 0:26:37
M579: Plotting Circles and Ellipses Parametrically
Комментарии