filmov
tv
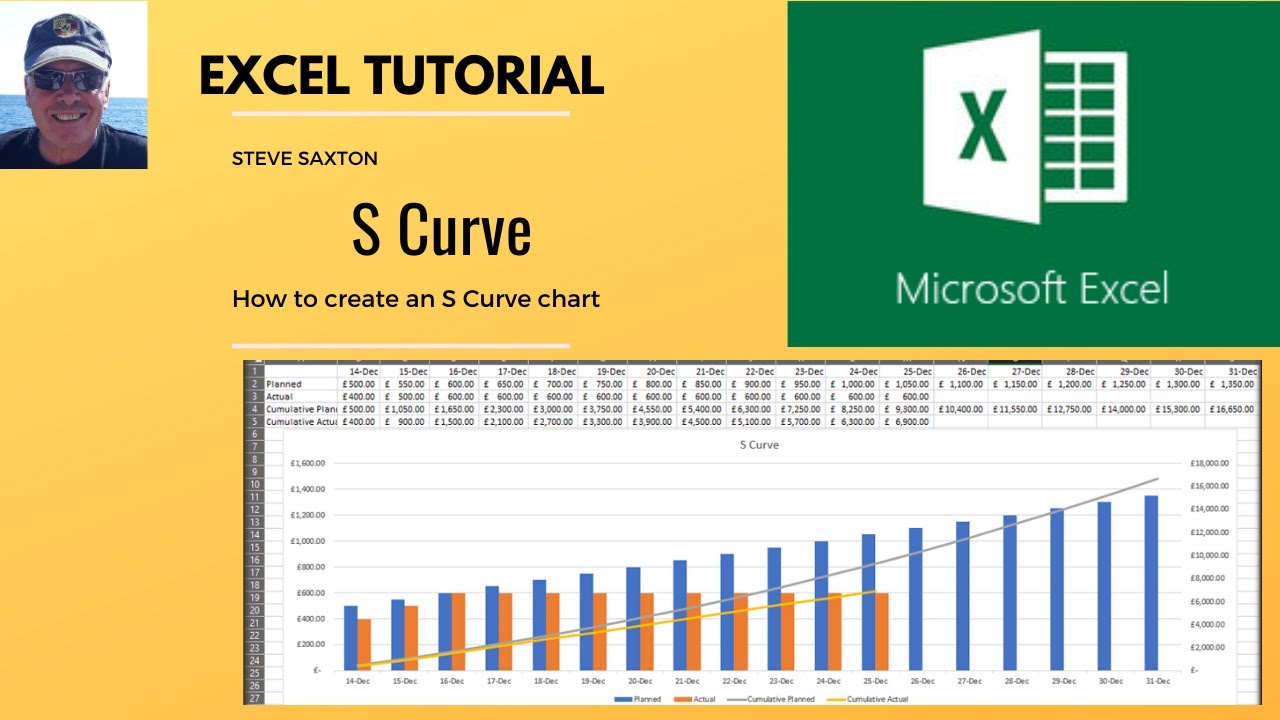
Add an S Curve in Microsoft Excel. S Curve
Показать описание
Add an S Curve in Microsoft Excel. This video explains how to add an S Curve chart in Microsoft Excel. The tutor demonstrates how to set out the data for the S curve chart. This example displays four lines of data for the S Curve chart. Planned, Actual, Cumulative planned and Cumulative Actual. The chart type used is a Combo chart with the two cumulative lines displayed on a secondary axis. The actual and planned figures are displayed as columns.
Playlists for this channel:
#itseasytraining
#scurve
Courses are available through Microsoft Teams, Online and Face to face in the UK
Training Guide Books
Excel for New Managers
Very cheap E_books are here:
Playlists for this channel:
#itseasytraining
#scurve
Courses are available through Microsoft Teams, Online and Face to face in the UK
Training Guide Books
Excel for New Managers
Very cheap E_books are here:
 0:01:56
How To Create S Curve In MS Excel || Progress Performance
 0:04:28
Add an S Curve in Microsoft Excel. S Curve
 0:08:05
Create S-Curve for Planned Target vs Actual Work from MS Project
 0:12:57
Creating an S-Curve Chart in MS Excel
 0:14:27
How to make Project's S-curve
 0:01:05
How to Create an S Curve Pattern in Microsoft Excel || How To Create S Curve In MS Excel
 0:03:20
Easiest Way to Create S - Curve From Microsoft Project Data
 0:02:20
How to Use S-Curve Analysis in Project Management
 1:11:31
Understanding lights, light sources and surfaces by adding them to my Raytracer!
 0:06:18
What Is S Curve In Project Management || Create S-Curve in Excel, Primavera P6
 0:03:22
What is S Curve?
 0:05:55
✅ How to add Daily Progress to the Weekly S-Curve?
 0:05:33
Easy Excel S-Curve Charts for Tracking Progress Over Time
 0:05:29
How To Make S-Curve Charts In Excel | Project Management | Office 365
 0:07:36
How to create a Financial S- Curve in Excel..#S-curve, #Civilengineering,#Highway,#Excel,NHAI
 0:08:03
Graph S Curves in Primavera P6
 0:15:59
Create S Curve Without Resources from Primavera P6 | By activity weightage calculation and Resources
 0:17:40
CONSTRUCTION SCHEDULE & S-CURVE EXAMPLE
 0:02:36
EXCEL TUTORIAL-HOW TO DRAW MULTIPLE CURVE IN EXCEL
 0:17:37
HOW TO CREATE S-CURVE GANTT CHART-imran amami channel
 0:08:09
STOP USING S-CURVES, do THIS instead: (Lightroom tone curves)
 0:06:05
Excel Gantt Chart S Curve
 0:09:52
Simplest Way of Developing S Curve in Power BI
 0:03:35
Understanding S-Curves
Комментарии