Debugging STM32 in VSCODE with stlink and jlink | VIDEO 45

preview_player
Показать описание
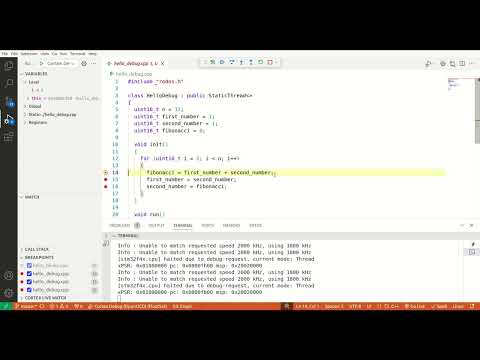
In this video I talk about hardware and software requirements for debugging STM32 in vscode using cortex-debug plugin.
I also talk about important compiler flags that can ruin debugging.

Feel free to navigate to these time points:
0:00 - Introduction
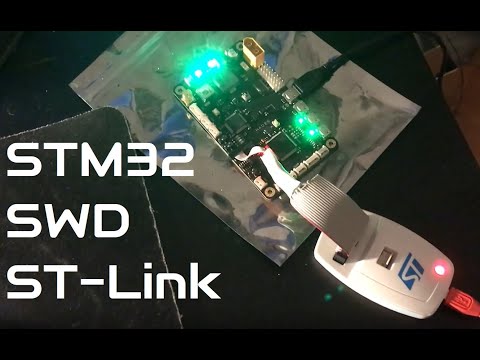
0:18 - Hardware used in the video
0:33 - Software for stlink and jlink upgrade and reflash
1:38 - stlink and jlink debugger software
3:10 - VSCode Cortex-Debug pluging and configuration
9:50 - JLink demonstration and Debug view walkaround
12:17 - STLink (st-util) demonstration
13:05 - Compiler optimizations for debugging

Links:

Project used in the video:
Рекомендации по теме
Комментарии
Автор

The timing of this video was perfect. This is something I was just looking into and then you came along. You are doing good work here!

efox
Автор

Thank you so much for such an easy to understand and informative video. I've wanted to learn how to use GDB with VS Code for my bare-metal work for quite some time and now I finally can! I really appreciate you taking the time to do this!!

funbotix
Автор

Thanks. These was one of the few videos i watched that was worth it . Keep up the good work !!!!.

digimations
Автор

This helped me a lot in setting up my VSCode for a Zephyr project on a ST Nucleo board.

SounakRanjanDas
Автор

Great and useful videos. Thank You, Matej

mojtaba.zamani
Автор

Bro, your videos are awesome, keep up the great work!

alexanderminor
Автор

Thanks a lot for the video, I have a JLink up running without any problems. Sadly Cortex-Debug still doesnt support SWO for ST-Link.

Usploll
Автор

Thanks for your great work! It would be nice if you could enable subtitles, they're good help when english is not first language and there are certain fine subtleties in the speech

alastorgdl
Автор

great videos! thanks super nice to use visual code and stm32 this way

dymastro
Автор

I have anpplication that has a bootloader and a main application, 2 bin files and one dfu file, i see the previous developer generated elf file for bootloader... when i try to debug I only get disassembly view and not C code... any clue how to go about getting it to show me the C code when stepping through

EdwinFairchild
Автор

Da li drzis casove stm32 programiranja?

zeljkogelic
Автор

the update to j-link on the firmware V2.J36.S7 and V2.J37.S7 doesnt work, downgrade doesnt work :(
in ST-Link Reflash ive got ERROR: Unsupported ST-LINK firmware
how to fix that?
EDIT:
it working on nucleo, doesn't working on original st link v2

popos
Автор

Thank you so much for this video! I got my stutil based debug running however it works only once. When I hit stop and try to hit run again later, I get the below error (I am using a Mac). If I force-close “st-util” and re-run, it works again! What am I missing ?


SERVER CONSOLE DEBUG: onBackendConnect: gdb-server session connected
libusb: warning [darwin_open] USBDeviceOpen: another process has device opened for exclusive access
libusb: error [darwin_claim_interface] USBInterfaceOpen: another process has device opened for exclusive access
st-util
2021-10-19T20:20:04 WARN usb.c: Stlink usb device found, but unable to claim (probably already in use?)
2021-10-19T20:20:04 DEBUG common.c: *** stlink_close ***

phenpag
Автор

HI does this work for clone stm32 chip?

amirabdjamalnuvending
Автор

Hi sorry for asking again. I run into another problem and I hope it is ok to ask again.

Now I can run the debugger using st-util and arm-none-eabi-gdb on VSCode, but it will not stop at the beginning(main).
It seems that it will run first and after a random amount of cycles then pause, in the while(1) loop. Below is my "launch.json file", I do add the "runToEntryPoint" tag:

"configurations": [
{
"name": "ST-Link Debug",
"cwd": "${workspaceFolder}",
"executable": "./build/CPP_Test.elf",
"device": "STM32F407VE",
"request": "launch",
"type": "cortex-debug",
"runToEntryPoint": "main",
"servertype": "stutil",
"interface": "swd"
}

and here is the debug output:

```
Reading symbols from --syms -C -h -w
Reading symbols from --defined-only -S -l -C -p
Launching GDB: -q --interpreter=mi2
Set "showDevDebugOutput": true in your "launch.json" to see verbose GDB transactions here. Helpful to debug issues or report problems
Launching gdb-server: /usr/local/bin/st-util -p 50000 --no-reset
Please check TERMINAL tab (gdb-server) for output from /usr/local/bin/st-util
Finished reading symbols from objdump: Time: 35 ms
Finished reading symbols from nm: Time: 41 ms
Reading symbols from
Warning: 'set target-async', an alias for the command 'set mi-async', is deprecated.
Use 'set mi-async'.

0x08004250 in main () at Core/Src/main.cpp:98
98 n++;
Program stopped, probably due to a reset and/or halt issued by debugger
Note: automatically using hardware breakpoints for read-only addresses.
Run to 'main' timed out. Trying to pause program
```
I'm not suire if it has something to do with the 5th line when launching gdb-server it use the "--no-reset
" flag. Thank you very much !!

李咨賢-pb
Автор

Thank you for your time.. But still I'm not able to run my debugging and I don't get why, I cofigured everything like in your video and also tried everything else... doesn't work

isaacyuki
Автор

Hi, not sure if you're still answering these questions, but I'll try anyway. I was able to configure debugging with st-util and it's nice as it can be targeted correctly by specifying serial numbers, as I often work with multiple devices connected to my PC. On the other hand, I can't get Live Watch to work with stutil, that's why I have another openocd configuration that manages to display Live Watch. The thing is that openocd doesn't target specific board even though I use serial number in the configuration. Any idea how I can get everything working on one debug server?

herantd
Автор

Anyone know how to get live expressions working with this method?

jokegum
Автор

A small warning regarding the optimization levels -O0 because i spent a few hours because of this. On specific models (32F4, 32F3 and probably others) usart, character received interrupt breaks. The RXNE bit fails to reset..
Also debugger breakpoints sometimes make the uart to break until the device is power cycled

ΓιώργοςΜιχάλης-ιξ
Автор

Thanks for this. I have a couple questions if you’re open to GI ring a couple answers. I have several Nucleo, Discovery, blue pill, and black pill (stm32f411 version) .

1) What are the differences between Jlink and STlink features?

2) There is a new STLink V3. Can you update a V2.0 or 2.1, or black pill to V3?

daque