filmov
tv
Microsoft Dynamics 365 - How to Create a Dashboard
Показать описание
Introduction:
- Do you want to follow your activities and your performance in a simple and illustrate way?
Don’t hesitate to use the Dashboard function in the Dynamics 365 app.
Development:
- Dynamics 365 allows you to have a complete view on your and your team or other department’s performances.
- To get it, it is really simple: you only have to go to the Service part of the app and click on Dashboard. (Show in the video how to access it)
- By clicking right here, you will have access to multiple dashboards that have already been created by the system. (Show in the video where the list of Dashboards can be found)
- You can then:
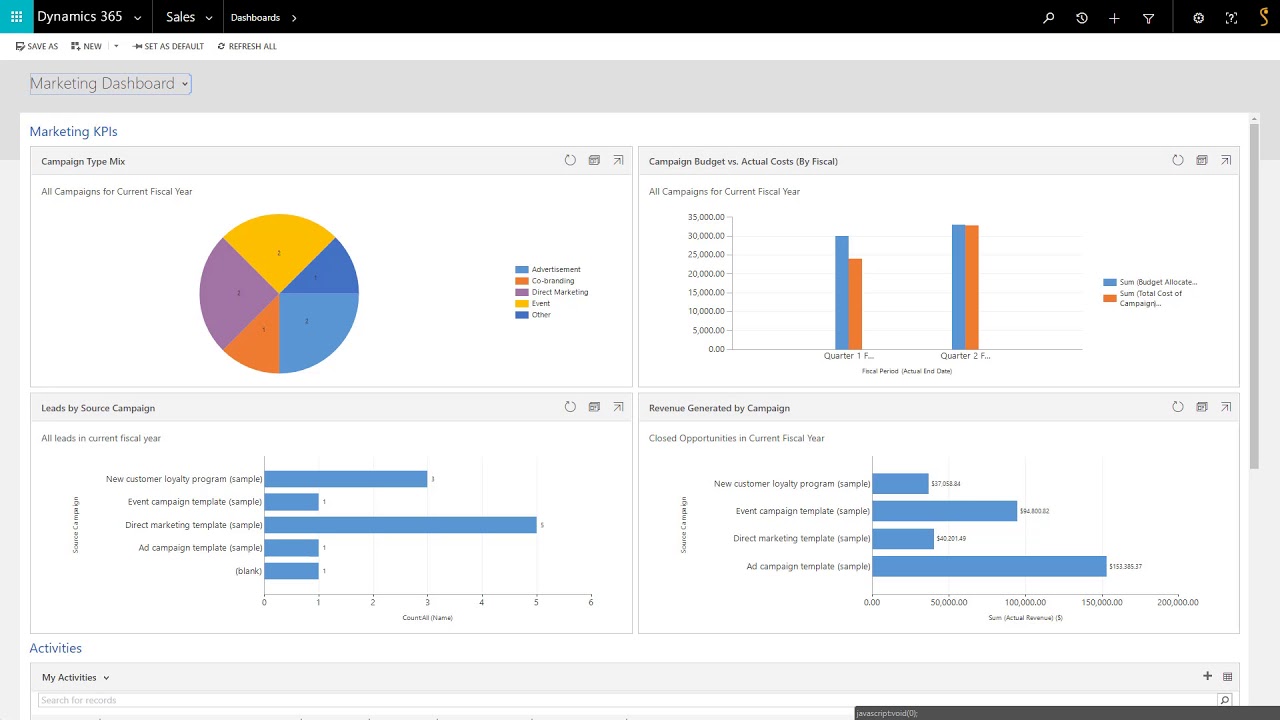
• Analyze Your performance (Show in the video the My performance dashboard)
• The performance of other departments like Marketing (Show in the video the Customer Service Manager Dashboard)
• And so much more (Shor the list of all the dashboards)
• You will have access to multiple key performance indicators shown with charts (Show in the video the charts of the My Performance Dashboard)
- It is the ideal tool to analyze everything at a glance!
- If you want to go further in your analysis,
- you can create your own dashboards that will only be access by you.
- Either you create a dashboard using an existing dashboard with the function Save as
- Or you start from scratch…
- You will need to click on the button New
- and customize your dashboard like you wish (Show in the video how to access it)
- You can choose :
• Its layout (screenshot)
• Its name so let’s name it my personal dashboard
• And of course don’t forget to save your modifications (screenshot)
• Its Key Performance Indicators (screenshot)
• The type of charts to illustrate it (screenshot)
• For example here I want to illustrate the open opportunities of our best clients
• You can then choose to insert a list
• A relationship assistant
• An Iframe or a webressource
• In this part of the dashboard
• Let’s choose to add a list of our competitor
• In the next part, let’s add the iFrame of the Gestisoft website
• By simply inserting its URL
• You can set the height and width of a section of your dashboard
• It’ also possible to delete one of the sections of your dashboard by pressing the delete key
• For the sake of our demo let’s increase the height width of our iFrame section.
• Select the iFrame section
• Click on the 3 dots
• And chose Increase Width.
• And increase height
• And finally press save and close
• You can now visualize your creation.
- It’s your turn to move!
- Once saved, you will be able to set your dashboard by default by simply clicking on this button (Show in the video how to access it)
- Your dashboard will be available in the list here underneath the My Dashboards section
- Now you know how to use this function and how to customize it.
Conclusion
Thank you for listening
And Don’t hesitate to look at our other videos to know more about all the functions you can find in Dynamics 365
- Do you want to follow your activities and your performance in a simple and illustrate way?
Don’t hesitate to use the Dashboard function in the Dynamics 365 app.
Development:
- Dynamics 365 allows you to have a complete view on your and your team or other department’s performances.
- To get it, it is really simple: you only have to go to the Service part of the app and click on Dashboard. (Show in the video how to access it)
- By clicking right here, you will have access to multiple dashboards that have already been created by the system. (Show in the video where the list of Dashboards can be found)
- You can then:
• Analyze Your performance (Show in the video the My performance dashboard)
• The performance of other departments like Marketing (Show in the video the Customer Service Manager Dashboard)
• And so much more (Shor the list of all the dashboards)
• You will have access to multiple key performance indicators shown with charts (Show in the video the charts of the My Performance Dashboard)
- It is the ideal tool to analyze everything at a glance!
- If you want to go further in your analysis,
- you can create your own dashboards that will only be access by you.
- Either you create a dashboard using an existing dashboard with the function Save as
- Or you start from scratch…
- You will need to click on the button New
- and customize your dashboard like you wish (Show in the video how to access it)
- You can choose :
• Its layout (screenshot)
• Its name so let’s name it my personal dashboard
• And of course don’t forget to save your modifications (screenshot)
• Its Key Performance Indicators (screenshot)
• The type of charts to illustrate it (screenshot)
• For example here I want to illustrate the open opportunities of our best clients
• You can then choose to insert a list
• A relationship assistant
• An Iframe or a webressource
• In this part of the dashboard
• Let’s choose to add a list of our competitor
• In the next part, let’s add the iFrame of the Gestisoft website
• By simply inserting its URL
• You can set the height and width of a section of your dashboard
• It’ also possible to delete one of the sections of your dashboard by pressing the delete key
• For the sake of our demo let’s increase the height width of our iFrame section.
• Select the iFrame section
• Click on the 3 dots
• And chose Increase Width.
• And increase height
• And finally press save and close
• You can now visualize your creation.
- It’s your turn to move!
- Once saved, you will be able to set your dashboard by default by simply clicking on this button (Show in the video how to access it)
- Your dashboard will be available in the list here underneath the My Dashboards section
- Now you know how to use this function and how to customize it.
Conclusion
Thank you for listening
And Don’t hesitate to look at our other videos to know more about all the functions you can find in Dynamics 365
 0:09:54
What is Dynamics 365?
 0:05:44
What is Microsoft Dynamics 365 | A quick Introduction | D365 Academy
 0:01:55
Introduction to Microsoft Dynamics 365 Business Central
 0:11:05
What is Microsoft Dynamics 365? [Introduction to D365 Finance and Operations, Business Central]
 0:47:19
Microsoft Dynamics 365 Sales (CRM): Tutorial for Beginners
 0:01:14
Introducing Microsoft Dynamics 365 Copilot
 1:47:51
Microsoft Dynamics 365 Virtual Training Day: Fundamentals (ERP) 1
 0:24:58
Introduction to Dynamics 365 Project Operations and roadmap
 0:03:51
What is Dynamics 365 Contact Center? | New Dynamics 365 product | D365 Contact Center overview
 0:23:33
Microsoft Dynamics CRM Tutorial for Beginners | Dynamics 365 CRM Training | Microsoft CRM Basics
 0:03:15
Microsoft Dynamics 365 Business Central overview
 1:29:26
Microsoft Dynamics 365 Tutorial For Beginners | Microsoft Dynamics 365 Training | NetCom Learning
 0:08:34
Microsoft Dynamics 365 Business Central: guida introduttiva
 0:48:52
Microsoft Dynamics 365 for Finance and Operations General Demo
 0:10:02
Microsoft Business Applications - Dynamics 365 and Power Platform concepts explained
 0:13:00
SAP S/4HANA vs Oracle ERP Cloud vs Microsoft Dynamics 365: How to Compare Leading ERP Systems
 0:02:36
What is Microsoft Dynamics 365? Explained in 2 minutes | NAV SEAL
 0:01:33
What is Dynamics 365? Introduction : All you need to know
 0:08:51
MS Dynamics 365 Job and career ( Telugu) | @LuckyTechzone
 0:12:05
Dynamics 365 Essentials for IT | Intro
 0:01:02
Learn the fundamentals of Microsoft Dynamics 365 Marketing
 0:04:36
Poznaj od podszewki rozwiązanie Microsoft Dynamics 365
 0:01:47
Microsoft Dynamics 365: CRM met onbegrensde mogelijkheden
 0:18:45
Microsoft Dynamics 365 Business Central overview | tutorials for beginners to pro | trending
Комментарии