filmov
tv
Understanding Scrum Metrics : Velocity, Burn down chart, Burn Up Chart

Показать описание
Story point are very useful, as it helps the teams to define their velocity, this is the measure of how many story points the team can take into a single Sprint and is the key metric in Scrum. Velocity is calculated at the end of the Sprint by totaling the Points for all fully completed User Stories.
Beside the velocity, scrum teams uses story point to track their progress using the brundown chart. A burndown chart is a graphic representation of how quickly the team is working through a customer’s user stories.
Story point are also useful for product owners when discussing planning and cost with the stakeholders through the use of the burn up chart.
#agile #businessagility #agility
 0:07:24
Understanding Scrum Metrics : Velocity, Burn down chart, Burn Up Chart
 0:05:51
Understanding scrum metrics| Velocity, Burn down chart, Burn up chart | CT Academy
 0:08:36
What Are Velocity, Burnup Charts And Burndown Charts | Understanding Scrum Metrics | Simplilearn
 0:15:20
Useful graphs metrics for Scrum Teams | Jira Reports
 0:22:04
Understanding Scrum Metrics and KPIs - Agile Digest
 0:06:18
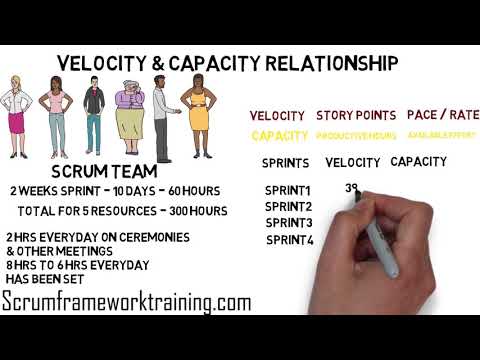
Agile Velocity and Capacity Planning Relationship
 0:10:08
Agile Metrics I Agile KPIs I Scrum KPIs I Scrum Metrics I Velocity I Burn down chart I Burn Up Chart
 0:17:56
How to improve development team velocity - Scrum metrics
 0:03:07
Capacity & Velocity in Scrum
 0:23:36
Scrum Metrics for Effective Project Delivery | Understanding Scrum Metrics | Invensis Learning
 0:05:45
POWERFUL AGILE METRICS THAT CHANGE THE GAME
 0:09:33
What Scrum Metrics to Implement as a New Scrum Master? #ScrumMaster
 0:58:03
Top 15 Agile Metrics I Agile KPIs I Scrum KPIs I Scrum Metrics
 0:01:00
Velocity in Scrum #scrum #metrics
 0:07:09
YDS: Which Metrics Do Todd and Ryan Use During a Sprint?
 0:24:00
Sprint/Release Burndown Chart|Sprint Velocity - How to Use/Interpret Scrum Metrics
 0:11:51
Metrics 📈 For Measuring The Scrum Team's Effectiveness [Don’t Use Velocity]
 0:48:55
Top 10 Agile Metrics I Agile KPIs I Scrum KPIs I Scrum Metrics I Scrum Master interview questions
 0:09:30
Why Velocity Is The Most Dangerous Metric in Agile & Scrum
 0:00:37
What is velocity in Scrum?
 0:07:19
What are a Burndown Chart, a Burnup Chart, and Velocity?
 0:11:13
MUST KNOW METRICS to MEASURE the Performance of your SCRUM TEAM
 0:08:21
How to find Velocity Before the Project start I scrum master interview questions
 0:08:11
Velocity in Agile Methodology | Velocity Metrics in Scrum (AGILE VELOCITY EXCEL TEMPLATE)
Комментарии