filmov
tv
WinCC Unified v17 # 16: JavaScript Debugging in Chrome Browser 🕷️ #WinCCGURU

Показать описание
This is #16 in our WinCC Unified v17 Course. This is a JavaScript Tutorial! Here we will cover how to enable debugging of scripts in your Chrome Browser Debugger using developer mode (F12). We will debug a script from our last video using these tools. We will cover opening the debugger in chrome, setting break points, and monitoring variable values through a loop to find the code issue. Enjoy!
#WinCC #SCADA #SCADAProgramming
00:00 Introduction
00:57 Error in accessing property in script
01:08 The TagSet help reference
01:55 New and Different errors :D
02:19 the JavaScript Chrome Debugger
02:41 Open SIMATIC Runtime Manager
02:55 Enable Unified Script Debugger
03:13 Find You Chrome Version
03:39 Start The Chrome Script Debugger
03:58 Be Patient :D
05:02 Add Breakpoint to code
05:41 Viewing var array in debugger
06:00 Stepping though code in debugger
06:21 mousing over vars in debugger
06:45 we found the problem!
07:10 Fixing the TagSet code
07:41 Testing the fix in Runtime
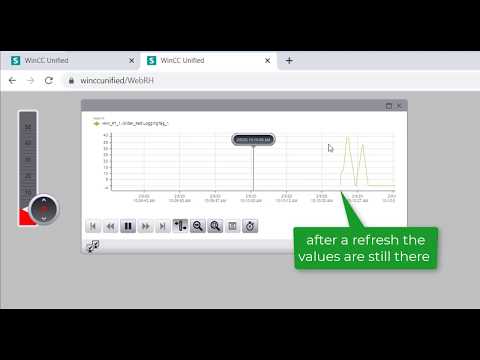
07:59 refresh your inspection page
08:16 Clear breakpoints in debugger!
08:31 Pro Tip Here !!!
09:47 The script now works!
10:11 Assignment Debugging
#WinCC #SCADA #SCADAProgramming
00:00 Introduction
00:57 Error in accessing property in script
01:08 The TagSet help reference
01:55 New and Different errors :D
02:19 the JavaScript Chrome Debugger
02:41 Open SIMATIC Runtime Manager
02:55 Enable Unified Script Debugger
03:13 Find You Chrome Version
03:39 Start The Chrome Script Debugger
03:58 Be Patient :D
05:02 Add Breakpoint to code
05:41 Viewing var array in debugger
06:00 Stepping though code in debugger
06:21 mousing over vars in debugger
06:45 we found the problem!
07:10 Fixing the TagSet code
07:41 Testing the fix in Runtime
07:59 refresh your inspection page
08:16 Clear breakpoints in debugger!
08:31 Pro Tip Here !!!
09:47 The script now works!
10:11 Assignment Debugging
 0:01:57
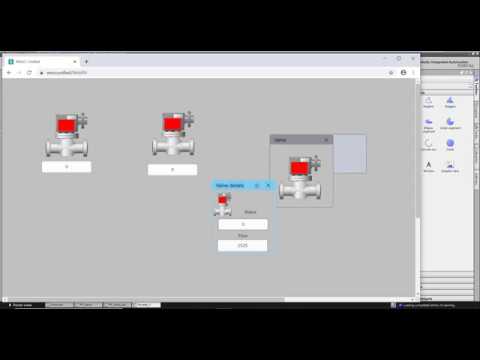
WinCC Unified V16 Faceplate: Part 4/9 open a Faceplate as PopUp from each screen object
 0:10:00
Khóa Học WinCC Unified V17 Part16: Text List and Graphic List Wincc Unified
 0:10:47
TIA Portal #1B: Siemens TIA Portal V17 & Fix Wincc Unified Installation Problem
 0:05:04
WinCC Unified V16: Screen navigation Tutorial Part 1 with two screen windows and the FindItem method
 0:11:46
TIA Portal V17 & WinCC Unified: Download, parallel Installation, convert V16 project & first...
 0:01:40
WinCC Unified V16: create a alarm log and display historical alarms in Runtime
 0:04:17
TIA Portal V16 & WinCC Unified: Download and Install
 0:08:37
WinCC Unified V17 # 7: Create Popup Screens In WinCC Unified! ✨Learn SCADA Programming! #WinCCGURU
 0:10:51
TIA Portal: WinCC Unified Installation Problems (Fixed)
 0:11:16
WinCC Unified v17 # 16: JavaScript Debugging in Chrome Browser 🕷️ #WinCCGURU
 0:07:22
WinCC Unified V17 # 4 : Creating Screens In TIA Portal 🎨 Learn SCADA Programming #WinCCGURU
 0:02:06
WinCC Unified V16: display Historical data in a trend on a Unified Comfort Panel
 0:07:18
WinCC Unified V16: How to use the Parameter set control for recipe handling
 0:00:38
WinCC Unified V16: how to connect the Unified Simulation with a S7-1500/1200 or S7-300/400 PLC
 0:01:46
WinCC Unified V16: Units on the I/O field by using the Output format
 0:03:12
WinCC Unified V16: Connect a Unified OPC UA Client to a OPC UA Server
 0:06:24
How to install Sim_EKB_Install Siemens licence key for TIA Portal wincc RT
 0:22:33
WinCC Unified V17 Part 1: Overview And First Project
 0:02:26
WinCC Unified V16: Auto login browser extension for google chrome
 0:29:09
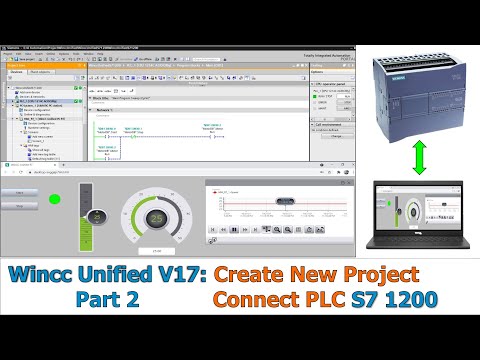
WinCC Unified V17 Part 2: Create New WinCC Unified Connect To PLC S7 1200
 0:06:41
Wincc Unified V17 Simatic Runtime connection
 0:01:32
WinCC Unified V16: connect the Trend companien to the Trend control and use the Calculate statistics
 0:08:32
WinCC Unified Comfort Panel V17: usage of the Webclient
 0:00:45
WinCC Unified V17 # 24: RT Collaboration & Certificate Manager Overview 📜🔐 #WinCCGURU
Комментарии