filmov
tv
Understanding PV Diagrams thermodynamics-Isobaric, isochoric, isovolumetric, isothermic adaiabatic |

Показать описание
PV Diagrams thermodynamics - explained ( Isobaric, isochoric, isovolumetric, isothermic and adaiabatic ) by Kisembo Academy
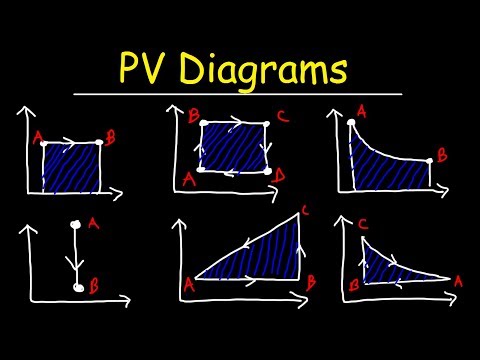
A pressure–volume diagram (or PV diagram, or volume–pressure loop) is used to describe corresponding changes in volume and pressure in a system. They are commonly used in thermodynamics, cardiovascular physiology, and respiratory physiology. In this video, we get to describe them in the thermodynamics angle
I would like to thank all of you that keep sending financial support via
your continued support has enabled us to keep producing these videos. Keep the support coming through and may God bless you more.
transcript;
0:00:00.060,0:00:05.250
in this session I'll be talking about PV
0:00:02.220,0:00:07.410
diagrams as we describe PV diagrams will
0:00:05.250,0:00:11.219
be in SS describing what we mean by
0:00:07.410,0:00:18.060
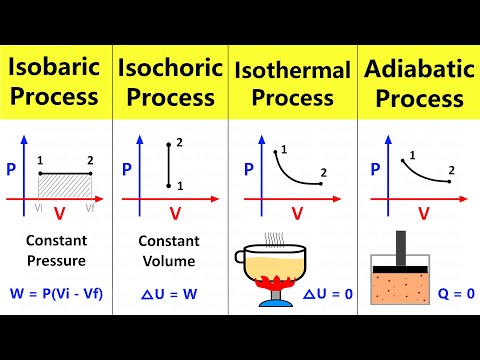
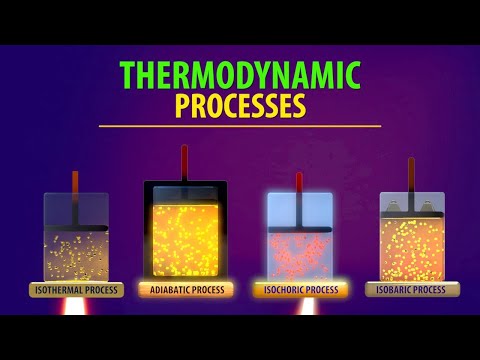
isobaric isometric isothermal under
0:00:11.219,0:00:20.970
there are basic processes coming up so
0:00:18.060,0:00:23.760
our PV diagrams PV stands for pressure
0:00:20.970,0:00:25.019
volume so a PV diagram is simply a graph
0:00:23.760,0:00:26.970
that is used to describe the
0:00:25.019,0:00:29.789
corresponding changes in pressure and
0:00:26.970,0:00:33.750
volume the system now let's consider a
0:00:29.789,0:00:36.000
gas in a container like this one if I
0:00:33.750,0:00:39.570
heat this gas there will be a process
0:00:36.000,0:00:42.450
that will take place if this guy this
0:00:39.570,0:00:45.059
process involves this heat that is
0:00:42.450,0:00:46.680
coming in increasing the kinetic energy
0:00:45.059,0:00:50.520
of the molecules here and as a result
0:00:46.680,0:00:52.620
this piston is pushed up and that means
0:00:50.520,0:00:54.899
the system does work against the
0:00:52.620,0:00:57.660
surrounding now likewise if I push this
0:00:54.899,0:00:59.730
piston downward like that I'll be doing
0:00:57.660,0:01:01.410
work on the system now in both these
0:00:59.730,0:01:05.220
processes the parameters like pressure
0:01:01.410,0:01:07.350
and volume of the gas will change now in
0:01:05.220,0:01:10.380
order to visualize these changes we make
0:01:07.350,0:01:12.780
use of what we call the PV diagram and
0:01:10.380,0:01:15.390
like I had earlier pointed out a PV
0:01:12.780,0:01:17.820
diagram is simply a graph that shows how
0:01:15.390,0:01:20.040
the pressure changes with respect to
0:01:17.820,0:01:22.740
volume now it's also important to take
0:01:20.040,0:01:25.890
note that we can know the amount of work
0:01:22.740,0:01:28.020
done colleagues or the amount of energy
0:01:25.890,0:01:31.290
expended in a system by simply
0:01:28.020,0:01:33.060
estimating the area under the graph that
0:01:31.290,0:01:34.890
will be drained here like we shall see
0:01:33.060,0:01:37.470
so we'll get started with what you call
0:01:34.890,0:01:40.020
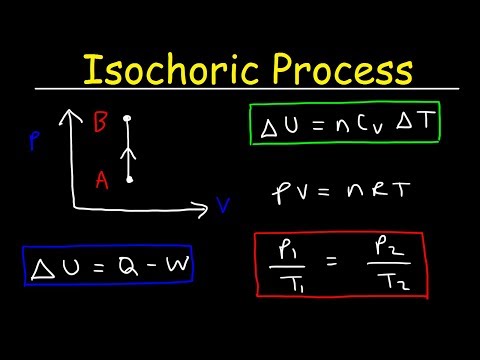
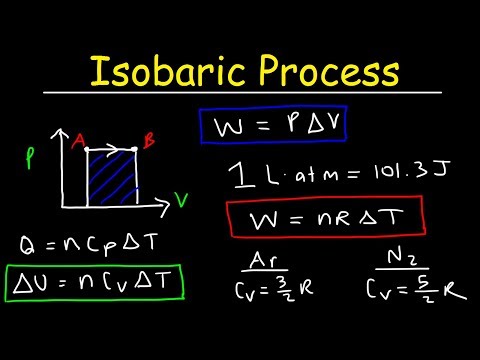
the isobaric process so now it is an
0:01:37.470,0:01:41.759
isobaric process an isobaric process is
0:01:40.020,0:01:45.450
simply a thermodynamic process so it's a
0:01:41.759,0:01:49.619
process that takes place when the
0:01:45.450,0:01:52.229
pressure is constant ISO means same same
0:01:49.619,0:01:54.270
pressure so it's a process that will
0:01:52.229,0:01:58.290
take place at constant pressure in
0:01:54.270,0:01:59.579
simple terms so if we're to draw if this
0:01:58.290,0:02:01.320
is a process of course when we are
0:01:59.579,0:02:03.299
holding the pressure constant if we are
0:02:01.320,0:02:05.310
to introduce it here and this is
0:02:03.299,0:02:06.780
supposed to be taking place at it in
0:02:05.310,0:02:08.670
such a way that pressure is held
0:02:06.780,0:02:12.510
constant it means that as heat is coming
0:02:08.670,0:02:13.319
in as this gas tends to expand in order
0:02:12.510,0:02:15.629
for us to keep
0:02:13.319,0:02:17.579
thus at a constant pressure that is
0:02:15.629,0:02:19.709
compensated for by this piston being
0:02:17.579,0:02:21.480
pushed upwards so as this piston is
0:02:19.709,0:02:25.349
being pushed upwards it will be pushed
0:02:21.480,0:02:27.959
probably from this point a VA to that
0:02:25.349,0:02:31.139
point VB so let's assume that it is
0:02:27.959,0:02:35.750
being this is the beginning point of
0:02:31.139,0:02:38.639
volume so this volume increases up to VB
#Physicsmaths
A pressure–volume diagram (or PV diagram, or volume–pressure loop) is used to describe corresponding changes in volume and pressure in a system. They are commonly used in thermodynamics, cardiovascular physiology, and respiratory physiology. In this video, we get to describe them in the thermodynamics angle
I would like to thank all of you that keep sending financial support via
your continued support has enabled us to keep producing these videos. Keep the support coming through and may God bless you more.
transcript;
0:00:00.060,0:00:05.250
in this session I'll be talking about PV
0:00:02.220,0:00:07.410
diagrams as we describe PV diagrams will
0:00:05.250,0:00:11.219
be in SS describing what we mean by
0:00:07.410,0:00:18.060
isobaric isometric isothermal under
0:00:11.219,0:00:20.970
there are basic processes coming up so
0:00:18.060,0:00:23.760
our PV diagrams PV stands for pressure
0:00:20.970,0:00:25.019
volume so a PV diagram is simply a graph
0:00:23.760,0:00:26.970
that is used to describe the
0:00:25.019,0:00:29.789
corresponding changes in pressure and
0:00:26.970,0:00:33.750
volume the system now let's consider a
0:00:29.789,0:00:36.000
gas in a container like this one if I
0:00:33.750,0:00:39.570
heat this gas there will be a process
0:00:36.000,0:00:42.450
that will take place if this guy this
0:00:39.570,0:00:45.059
process involves this heat that is
0:00:42.450,0:00:46.680
coming in increasing the kinetic energy
0:00:45.059,0:00:50.520
of the molecules here and as a result
0:00:46.680,0:00:52.620
this piston is pushed up and that means
0:00:50.520,0:00:54.899
the system does work against the
0:00:52.620,0:00:57.660
surrounding now likewise if I push this
0:00:54.899,0:00:59.730
piston downward like that I'll be doing
0:00:57.660,0:01:01.410
work on the system now in both these
0:00:59.730,0:01:05.220
processes the parameters like pressure
0:01:01.410,0:01:07.350
and volume of the gas will change now in
0:01:05.220,0:01:10.380
order to visualize these changes we make
0:01:07.350,0:01:12.780
use of what we call the PV diagram and
0:01:10.380,0:01:15.390
like I had earlier pointed out a PV
0:01:12.780,0:01:17.820
diagram is simply a graph that shows how
0:01:15.390,0:01:20.040
the pressure changes with respect to
0:01:17.820,0:01:22.740
volume now it's also important to take
0:01:20.040,0:01:25.890
note that we can know the amount of work
0:01:22.740,0:01:28.020
done colleagues or the amount of energy
0:01:25.890,0:01:31.290
expended in a system by simply
0:01:28.020,0:01:33.060
estimating the area under the graph that
0:01:31.290,0:01:34.890
will be drained here like we shall see
0:01:33.060,0:01:37.470
so we'll get started with what you call
0:01:34.890,0:01:40.020
the isobaric process so now it is an
0:01:37.470,0:01:41.759
isobaric process an isobaric process is
0:01:40.020,0:01:45.450
simply a thermodynamic process so it's a
0:01:41.759,0:01:49.619
process that takes place when the
0:01:45.450,0:01:52.229
pressure is constant ISO means same same
0:01:49.619,0:01:54.270
pressure so it's a process that will
0:01:52.229,0:01:58.290
take place at constant pressure in
0:01:54.270,0:01:59.579
simple terms so if we're to draw if this
0:01:58.290,0:02:01.320
is a process of course when we are
0:01:59.579,0:02:03.299
holding the pressure constant if we are
0:02:01.320,0:02:05.310
to introduce it here and this is
0:02:03.299,0:02:06.780
supposed to be taking place at it in
0:02:05.310,0:02:08.670
such a way that pressure is held
0:02:06.780,0:02:12.510
constant it means that as heat is coming
0:02:08.670,0:02:13.319
in as this gas tends to expand in order
0:02:12.510,0:02:15.629
for us to keep
0:02:13.319,0:02:17.579
thus at a constant pressure that is
0:02:15.629,0:02:19.709
compensated for by this piston being
0:02:17.579,0:02:21.480
pushed upwards so as this piston is
0:02:19.709,0:02:25.349
being pushed upwards it will be pushed
0:02:21.480,0:02:27.959
probably from this point a VA to that
0:02:25.349,0:02:31.139
point VB so let's assume that it is
0:02:27.959,0:02:35.750
being this is the beginning point of
0:02:31.139,0:02:38.639
volume so this volume increases up to VB
#Physicsmaths
 0:24:24
 0:07:53
 0:20:17
 0:11:54
 0:11:01
 0:06:43
 0:02:53
 0:04:16
 0:07:28
 0:10:10
 0:09:19
 0:14:27
 0:06:05
 0:08:10
 0:17:43
 0:10:44
 0:11:54
 0:05:35
 0:20:24
 0:05:32
 0:01:34
 0:18:39
 0:12:07
 0:10:23