filmov
tv
Is Bollinger Bands Indicator + RSI Trading Strategy Profitable? - Full Tutorial with Trade Examples

Показать описание
Is Bollinger Bands Indicator and RSI Trading Strategy Profitable? - Full Tutorial with Trade Examples
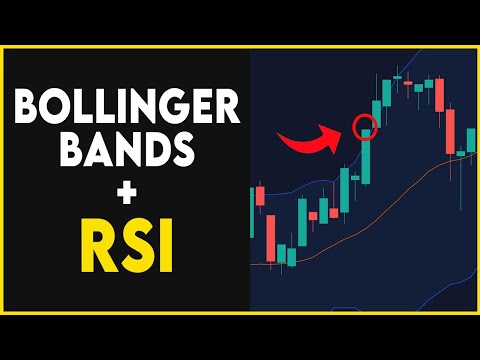
In today's video, we are combining the Bollinger Bands indicator with the Relative Strength Index in one single trading strategy, this is one of the strategies suggested by some of the subscribers of this channel after watching the videos where we backtested
the Bollinger Bands trading indicator as well the RSI. The results were quite promising, but what if we trade Forex using the two indicators simultaneously.
So if you are looking for a video on how to trade the Bollinger Bands or you would like to know whether it is a good strategy combined what the RSI indicator, that this video is right for you.
That's what we are going to do today.
Bollinger Bands is developed by John Bollinger in the 1980s and it is commonly used to measure the volatility of an asset.
There are 3 components to Bollinger. The first one is just a simple 20-day moving average which is represented by the middle band. The second and third are the upper and lower bands that are two standard deviations away from the 20-day Simple Moving Average.
In general, when the bands tighten during a period of low volatility, it raises the likelihood of a sharp price move in either direction. This may begin a trending move. Watch out for a false move in the opposite direction which reverses before the proper trend begins.
RSI is a momentum oscillator that measures the speed and change of price movement. The RSI oscillates between 0 to 100, where anything above 70 traditionally represents overbought and anything below 30 represents oversold.
In an uptrend or bull market, the RSI tends to remain in the 40 to 90 range with the 40-50 zone acting as support. During a downtrend or bear market, the RSI would stay between the 10 to 60 range with the 50-60 zone acting as resistance. These ranges will vary depending on the RSI settings and the strength of the currency pair.
So should we trade the Bollinger Bands with RSI indicator? Make sure to watch the video till the end to know the answer.
If you are looking for a solid trading strategy to capture pips on a daily basis that this strategy is for you.
#Bollinger_Bands #RSI_Indicator
Our Recommended Courses:
Contact us:
Start Trading Today:
Our Recommended Course:
Support Our Channel:
Download:
Video tags:
bollinger bands
bollinger bands indicator
bollinger bands explained
bollinger bands tested
bollinger bands tested 100 times
bollinger bands strategy
rsi
relative strength index
bollinger bands and rsi strategy
bollinger bands trading strategy
rsi trading strategy
rsi indicator
rsi divergence trading strategy
bollinger bands forex
bollinger bands trading
how to trade with bollinger bands
bollinger bands trading strategy
bollinger bands trading system
bollinger bands breakouts
bollinger bands signals
how to use bollinger bands
bollinger bands day trading
tested 100 times
 0:06:41
Bollinger Band + RSI Trading Strategy That Actually Works
 0:10:39
The Only BOLLINGER BANDS Strategies You Will Ever Need
 0:20:22
ULTIMATE Bollinger Bands Trading Course (INSANELY ACCURATE)
 0:10:02
Is Bollinger Bands Indicator + RSI Trading Strategy Profitable? - Full Tutorial with Trade Examples
 0:09:40
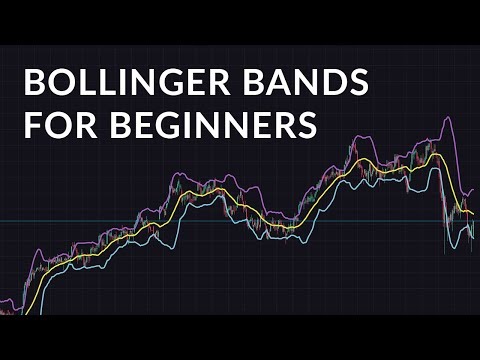
Bollinger Bands: Beginner Guide
 0:15:30
#StockMarket for Beginners | #BollingerBands Trading Strategy | Technical Analysis
 0:06:54
Bollinger Bands Trading Strategy (92% Win Rate)
 0:08:18
I TESTED a '92% win rate' Bollinger Bands Trading Strategy with NO STOP LOSS - Scalping St...
 0:15:48
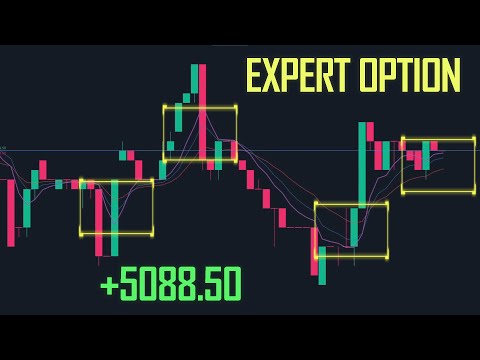
This is How I Win Every Single DAY 🧠 I Expert Option EUR USD
 0:24:54
Bollinger Bands: Why Millionaire Traders Are Using This Technical Indicator
 0:09:32
BEST Bollinger Bands Breakout Strategy For Daytrading Forex (Bollinger Bands Tutorial)
 0:03:28
How To Use Bollinger Bands In TradingView | Bollinger Band TradingView Indicator
 0:08:56
Bollinger Bands Trading Strategy: How to Trade it Like a PRO
 0:00:37
How To Trade Bollinger Bands **Best Method** 📈
 0:12:33
Bollinger Bands Trading Strategy MASTERCLASS | Support and Resistance RSI | Stock Market | MACD
 0:11:38
The Trading Indicator That Is 10X Better Than The Bollinger Bands
 0:13:35
Bollinger Bands Trading Strategy | Learn Stock Market Indicators
 0:07:44
Bollinger Band Trading Strategy | Band Squeeze | Bollinger Band Divergence
 0:00:47
This Indicator is BETTER than Bollinger Bands #shorts
 0:06:27
Bollinger Bands Width Indicator Explained
 0:04:13
📈 USE INDICATORS TO BOOST YOUR INCOME ON TRADING | Bollinger Bands Strategies | Bollinger Bands
 0:08:23
Bollinger Bands Trading Strategy Explained
 0:13:22
How to use Bollinger Bands to capture big breakouts?
 0:36:10
Bollinger Bands + RSI Explained
Комментарии