filmov
tv
Excel to Power BI Portfolio Project | Full End-to-End Data Project | #excel #sql #powerbi #python
Показать описание
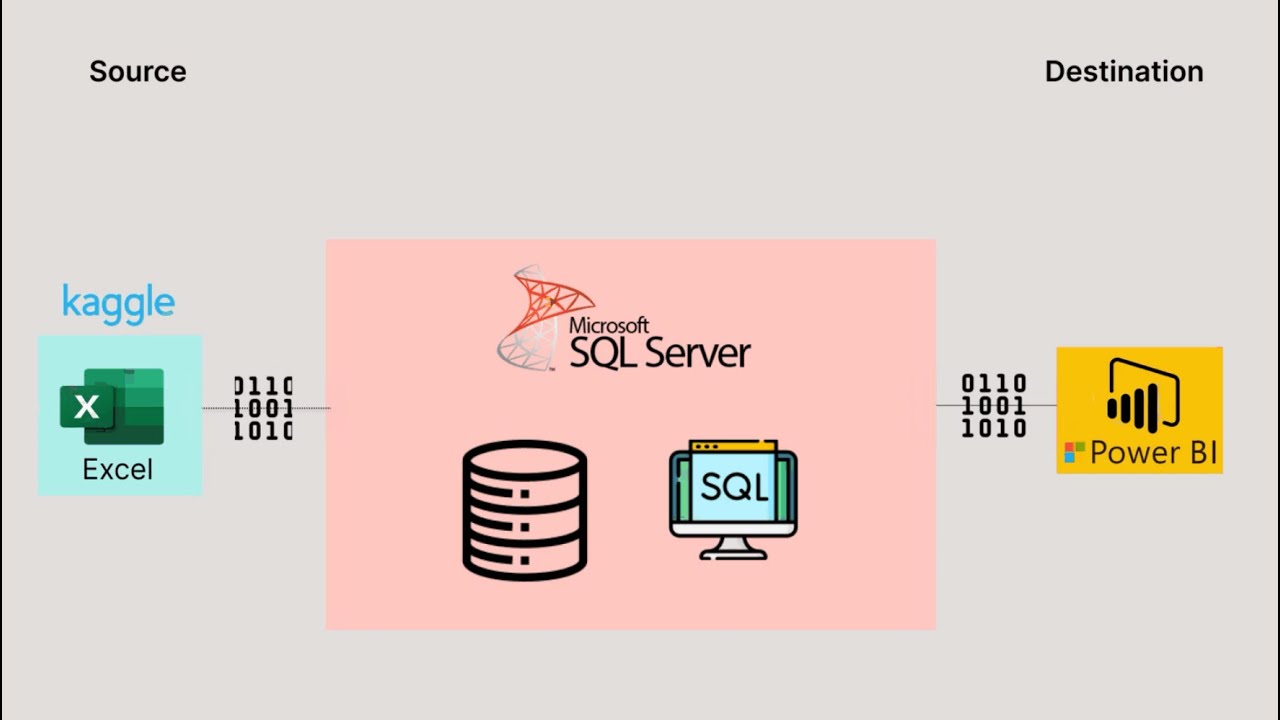
💻 We are pulling data from Kaggle, exploring and analysing it in Excel, cleaning and testing it in SQL, and visualizing it in Power BI. Follow along at your own pace - feel free to drop any questions or feedback you have in the comments below.
📩 Join my community here:
How to join:
____________________________________________
📲 Socials:
____________________________________________
🎁 Free Resources:
Here are some of the free resources I’ve created that you may find useful for your own data projects:
* My templates & guides (coming soon, feel free to ask me for them!!!)
Here are some of the resources used in this project:
____________________________________________
📩 Installation links:
Download these resources mentioned in the project:
____________________________________________
🎶 Music used:
Creative Commons CC BY-SA 3.0
____________________________________________
⏲️ Timestamps:
- Introduction (00:00:00)
- Pipeline architecture (00:01:29)
- Stages of the project (00:02:33)
- Objective (00:06:21)
- Create the requirements (00:08:30)
- Design the dashboard (00:13:11)
- Get data from Kaggle (00:17:39)
- Explore the data (00:18:41)
- Import into SQL (00:21:45)
- Clean data with SQL (00:24:54)
- Create SQL view (00:36:37)
- Test data (00:38:40)
- Import into Power BI (00:53:00)
- Create DAX measures (00:55:10)
- Build the visuals (01:07:52)
- Create the table visual (01:08:34)
- Create the tree map visual (01:11:46)
- Create the scorecards (01:14:48)
- Create the bar chart (01:17:43)
- Clean up the dashboard (01:08:34)
- Set up GitHub Pages (01:28:57)
- Create an ‘assets’ folder (01:30:43)
- Enable GitHub Pages (01:38:13)
- Edit ‘README.md’ file (01:39:39)
- Change theme of portfolio website (01:41:17)
- Create Excel analysis workbook (01:45:28)
- Calculate potential ROI in Excel (01:53:32)
- Validate calculations in SQL (02:01:28)
- Define variables in SQL (02:04:00)
- Create a CTE (02:05:53)
- Create calculated columns in SQL (02:11:54)
- Sort SQL results by net profit (02:17:00)
- Create a ‘difference’ table in Excel (02:18:50)
- Populate remaining columns in Excel (02:23:05)
- Format Excel analysis workbook (02:24:37)
- Analyse the data (02:25:57)
- Add recommendation to Excel workbook (02:29:46)
- Overview of GitHub portfolio website (02:32:55)
- Update GitHub portfolio via ‘README.md’ file (02:36:01)
- Add headers (02:36:41)
- Add table of contents (02:37:53)
- Add images (02:38:48)
- Add code blocks (02:39:23)
- Add markdown tables (02:40:09)
- Find markdown cheat sheet (02:41:58)
- Closing announcements (02:44:13)
 2:45:21
Excel to Power BI Portfolio Project | Full End-to-End Data Project | #excel #sql #powerbi #python
 0:08:21
Guided Portfolio Projects on Coursera | Python, SQL, Excel, Power BI, and Tableau
 0:20:59
Create a Data Analyst Portfolio Site | Build Powerful Resume | Power BI Portfolio
 0:55:38
The ONLY EXCEL PORTFOLIO PROJECT YOU NEED
 0:35:01
Data Analyst Portfolio Project: Build an Excel Dashboard (with Solutions)
 1:14:38
The Only Power BI Portfolio Project You Need
 0:10:06
Data Analyst Portfolio Project - Intro & Setup - Power BI & Excel
 0:07:53
THIS Data Analytics Portfolio will ACTUALLY get you a Job
 1:09:32
SQL Data Analysis Portfolio Project #01/10 | Beginner to Advanced Guide for Aspiring Data Analysts
 0:10:29
Building Your First Data Analytics Portfolio: A Step-by-Step Guide (2024)
 0:00:29
Project Portfolio Dashboard Overview
 0:12:57
Data Analyst Portfolio Project - Final Result - Power BI & Excel
 0:06:43
How to add your excel file, project to the portfolio website
 0:14:39
10 PORTFOLIO PROJECTS TO ADD TO YOUR DATA PORTFOLIO
 6:37:00
Data Analyst Portfolio Project | Power BI + SQL + Tableau + Excel | Beginner to Advanced |End to End
 5:20:30
Data Analyst Portfolio Project | Complete Project | Start to End | #powerbi #sql #tableau #excel
 1:33:00
Power BI Project End to End | Data Analyst Project Portfolio (Part 1) | Dashboard | For Beginners
 1:05:42
SQL & Excel Portfolio Project | Data Analyst Portfolio Project | Excel Project |For Beginners Pa...
 0:27:06
Excel Stock Portfolio Dashboard - FREE File Download
 0:07:16
5 Projects for a Data Analyst Job | All Materials Included
 1:55:34
Amazing Real Time Power BI Project | Start to End Analysis | Power BI For Beginners | Power BI 2024
 0:00:47
Data Analysis Portfolio Project #powerbi # tableau #excel #sql
 0:12:32
Power BI Tutorial for Beginners
 6:08:17
Data Analyst Portfolio Project | Power BI + SQL + Tableau + Excel | For Beginners |End to End
Комментарии