filmov
tv
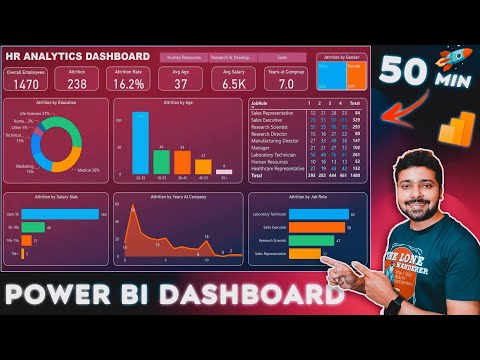
Power BI Project End to End | Data Analyst Project Portfolio (Part 1) | Dashboard | For Beginners

Показать описание
#powerbi #dataanalytics #powerbitutorial
Power BI Project End to End | Data Analyst Project Portfolio | Dashboard | For Beginners
⭐For Tableau, Power BI and Excel Projects contact me on my mail id or WhatsApp number mentioned at the end of description box.
⭐Data Analyst Material available at very minimal cost of Rs. 999. This will include a complete Data Analyst Syllabus with video links, important pdf's, Q&A, this will also include Complete project on Excel (2 Projects), Tableau (2 Projects) and Power BI (1 Project). And the projects will be different from that uploaded on You Tube. If you are interested to buy contact me on my mail or WhatsApp.
Details mentioned below-
WhatsApp - +91 9579005495
➖➖➖➖➖➖➖➖➖➖➖➖➖
In this video you will learn how to connect Power BI to MS SQL Server DB
#powerbitutorial #powerbitutorialforbeginners #dataanalytics #project #powerbi
➖➖➖➖➖➖➖➖➖➖➖➖➖
Do you want to become a Data Analyst or learn data analytics ? This channel is all about learning data science skills, tips and projects. My goal is to help you learn everything you need to start or switch your career into data science. I teach different Data Analyst tools like Tableau Desktop, Power BI, Excel, Advanced Excel, SQL, Postgres, python, etc.
➖➖➖➖➖➖➖➖➖➖➖➖➖
⭐Content of Video
00:00 Introduction to Project
08:49 Steps in Project
09:44 Problem Statement
12:07 What you will Learn?
14:34 Data Walkthrough
20:30 Import Data in MS SQL Server DB
31:25 Connect Power BI to MS SQL Server DB
36:58 Connect Power BI to Flat File (.csv)
44:19 Creating Date Table
50:53 Data Modeling
52:58 Adding Background
57:30 Developing KPI's
⭐Power BI Topics Covered
- What is Power BI
- How to connect Power BI to MS SQL Server and PostgreSQL DB
- Import data in Power BI
- Data Cleaning in Power BI
- Data Modelling in Power BI
- Power Query Editor
- DAX in Power BI
- Measures and Calculations in Power BI
- Charts in Power BI
- Filters and Slicers in Power BI
- Dashboard in Power BI
- Insights from Dashboard
➖➖➖➖➖➖➖➖➖➖➖➖➖
Checkout my other videos on dashboards design in Tableau, Power BI and Excel below-
⭐Tableau Dashboard-
⭐Power BI Dashboard
⭐Excel Dashboard
➖➖➖➖➖➖➖➖➖➖➖➖➖
⭐Tableau Material available-
1. Tableau hand written notes
2. Tableau printed Soft copy notes
2. Tableau important formulae notes
3. Tableau important interview questionnaire
All these are available at very minimal cost of Rs.200 only, ping me on WhatsApp to get these.
➖➖➖➖➖➖➖➖➖➖➖➖➖
WhatsApp - +91 9579005495
➖➖➖➖➖
Related Keywords -
power bi tutorial ,power bi desktop tutorial ,power bi tutorial for beginners ,power bi desktop ,power bi dashboard ,power bi training ,power bi demo ,power bi for beginners ,power bi dashboard tutorial ,power bi tutorial for beginners excel ,power bi ,tutorial ,desktop ,dashboard ,excel ,microsoft excel ,power bi vs tableau ,tableau vs power bi ,mspowerbi ,Power BI Pro ,PowerBIPro , swapnjeet, Microsoft PowerBI, Microsoft Power BI, PowerBI
Disclaimer: All opinions or statements in this video are my own and do not reflect the opinion of the company I work for or have ever worked for.
Data used in the video is a demo data, modified data and does not belong to any real time industry/ company/ government etc. Data used is only for practice purpose.
 1:06:26
Power BI Project End to End Dashboard Development | Beginners | Power BI Tutorial 2024
 0:52:19
Power BI Project End to End | Dashboard | Beginners | Complete Project - 2023
 0:44:31
Power BI Project End to End | Dashboard | Beginners | @Pavan Lalwani
 1:06:44
Power Bi Project End-to-end | Sales Dashboard | Beginners | Complete Project | Resume - 2024
 0:38:09
Power BI Dashboard For Data Analyst | End-to-End project for Beginners
 1:55:45
Power BI Project End to End | Dashboard | Beginners | Power BI Tutorial 2023
 1:37:25
End to End Data Analytics Project | Power BI Project | Hospitality Domain
 0:42:37
Full Power BI Guided Project | Microsoft Power BI for Beginners
 3:02:18
Hands-On Power BI Tutorial 📊 Beginner to Pro [Full Course] 2023 Edition⚡
 3:40:48
ULTIMATE Power BI Tutorial 📊 Beginner to Pro Course (2024)
 0:45:15
Advanced Power BI Project • End-to-End • ChatGPT • Custom Visuals
 1:55:34
Amazing Real Time Power BI Project | Start to End Analysis | Power BI For Beginners | Power BI 2024
 0:27:37
HR Data Analytics & Awesome Dashboard with Power BI 💡: End-to-End Project
 0:38:22
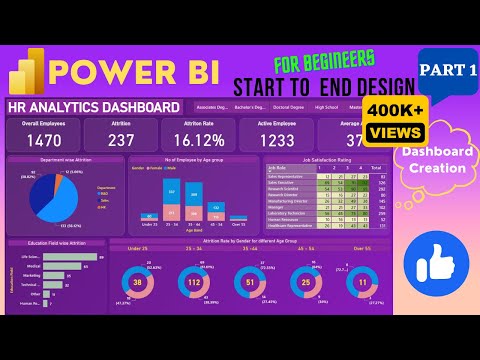
Power BI Dashboard from Start to End (Part 1)| HR Dashboard | Beginner to Pro | Power BI Project
 1:33:00
Power BI Project End to End | Data Analyst Project Portfolio (Part 1) | Dashboard | For Beginners
 1:14:22
Build a Power BI Dashboard in 70 min | Power BI Project | End to End | Beginner to Pro | #powerbi
 2:45:21
Excel to Power BI Portfolio Project | Full End-to-End Data Project | #excel #sql #powerbi #python
 0:57:03
Power BI Project For Beginners | Power BI Tutorial 2023 | Power BI Dashboard #powerbi
 2:45:02
Power BI End to End Project ( Banking Domain)
 2:46:44
Power BI & SQL Project | Data Analyst Portfolio | End to End | Beginner to Expert | #powerbi #s...
 1:36:04
End to End Data Analysis Project | HR Analytics Power BI Project 🚀
 0:41:07
How to Build Power BI Reports from Start to Finish
 1:01:52
End-to-End Data Analysis Project 2024 | SQL & Power BI | Beginner Friendly
 1:12:45
Complete Project with Power BI, Power Apps, Power Automate and Dataverse
Комментарии