filmov
tv
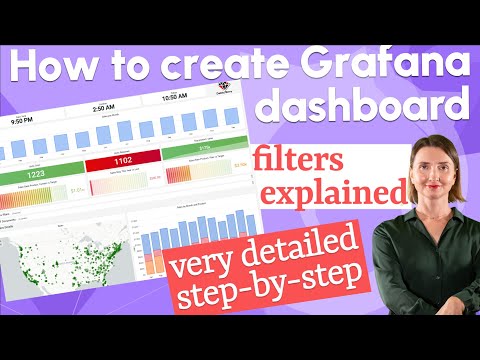
Grafana dashboard variables on steroids | Variable panel with Single, Multi, Tree View layouts

Показать описание
The video demonstrates the MVP of the variable panel. Since the video has been recorded/published, we already have many new features implemented.
More recent video:
LINKS FROM THE VIDEO
CHAPTERS
0:00 Intro
0:55 Single variable example plus all basic features highlighted
4:35 Multiple variables example
7:00 Tree View layout example
DISCOVER
GET IN TOUCH
#Grafana #GrafanaPlugins #Visualization #visualización
More recent video:
LINKS FROM THE VIDEO
CHAPTERS
0:00 Intro
0:55 Single variable example plus all basic features highlighted
4:35 Multiple variables example
7:00 Tree View layout example
DISCOVER
GET IN TOUCH
#Grafana #GrafanaPlugins #Visualization #visualización
 0:10:34
Grafana dashboard variables on steroids | Variable panel with Single, Multi, Tree View layouts
 0:14:44
Create your Business Grafana dashboard | Step by step for analysts | Grafana Tutorial
 0:14:22
Variable Panel for Grafana | New features and updates | Easy tutorial
 0:14:19
Data Manipulation for Grafana | Use REST API, Data Source and Queries to manipulate your data
 0:13:27
Home Automation on STEROIDS #2 (Home Assistant, AppDaemon, FloorPlan, Grafana, InfluxDB, Powerwall)
 0:02:32
Grafana v5.0 Alpha Preview
 0:11:56
Sensu Check Metric Extraction with InfluxDB and Grafana
 0:10:23
Canvas panel for Grafana | Advanced animated SVG element
 0:25:19
Grafana - Install and Configure Grafana, InfluxDB, telegraf - 1
 0:06:00
30.b - Filtros simples no SQL do DB Zabbix para Grafana
 0:04:16
7. Grafana - Monit interface
 0:14:33
Creating a Smart Home Dashboard (1 of 2)
 0:13:15
Home Assistant: 10$ WiFi Energy plug meters with ESPhome (Grafana) part - 3
 0:42:50
BEAM + Prometheus + Grafana = Observability Heaven | Alex Koutmos | Code BEAM V America 21
 0:05:57
Intro Grafana
 1:02:19
LogQL v2 Public Design Call 2 2020-06-29
 0:14:29
Intro to Promscale: Advanced analytics for Prometheus
 1:17:56
Home Assistant Glances and Grafana
 0:35:43
Ryan McKinley [Grafana Labs] | Grafana and InfluxDB |
 0:11:54
Apache ECharts panel for Grafana | Explore possibilities
 0:20:22
Grafana Docker for Home Assistant on Synology - #003
 1:02:11
OSMC 2022 | The Power of Metrics, Logs & Traces with Open Source by Emil Andreas Siemes
 0:01:57
Network Monitoring based on network system model with zabbix and grafana
 0:05:43
Creating a custom fund analytics dashboard in Visible
Комментарии