filmov
tv
Laffer Curve Explained (How The Ideal Tax Rate Is Determined ?)

Показать описание
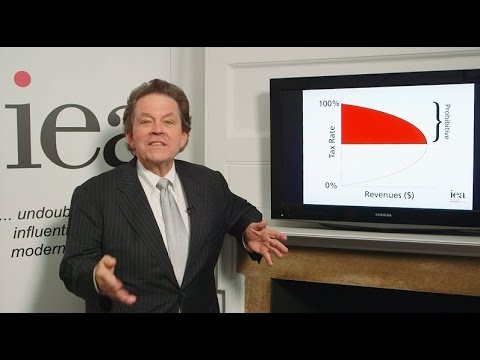
Developed by the economist Arthur Laffer in the 1970s, the Laffer Curve is a theoretical concept in economics that illustrates the relationship between tax rates and government revenue. The Laffer Curve is typically depicted as a graph with tax rates on the horizontal axis and government revenue on the vertical axis. Let's see a simplified explanation of the Laffer Curve on this chart. When tax rates are at 0%, the government collects no revenue because there are no taxes being levied. On the other hand, if tax rates were at 100%, people would have no incentive to work or invest because all their income would be taken in taxes. As a result, the government would also collect no revenue because there would be no taxable income. Between 0% and 100%, there should be an optimal tax rate at which government revenue is maximized. This is the point where the tax rate can maintain a balance between generating enough revenue and not discouraging economic activity. Tax rates lower than that pivot point will show an Upslope on the chart. Those tax rates can stimulate economic activity and lead to an increase in government revenue. This occurs as people are more willing to work, invest, and engage in taxable transactions due to the lower tax burden. In comparison, beyond the optimal tax rate, if tax rates are increased further, it will show an Downslope on the chart, which can lead to a decrease in government revenue. This is because higher tax rates can discourage work, investment, and economic growth. People may choose to work less, evade taxes, or engage in tax planning to reduce their taxable income.
Although Laffer Curve is a theoretical concept, one of the most famous real-world examples is the Laffer Curve's influence on the tax policies of the United States during the 1980s. In the 1980s, the United States, under President Ronald Reagan, implemented significant tax cuts. These tax cuts were based on the belief that reducing tax rates, particularly for high-income individuals and corporations, would stimulate economic growth and lead to increased government revenue. The Economic Recovery Tax Act of 1981 and the Tax Reform Act of 1986 significantly lowered the top marginal tax rate for individuals, reduced corporate tax rates, and implemented other tax reforms. As a result of the tax cuts, there was a noticeable increase in economic activity. Economic growth and job creation were substantial during the 1980s. While tax rates were lowered, government revenue also increased over the decade. The 1980s experience is often cited as an example of the potential positive impact of reducing tax rates, which aligns with the idea behind the Laffer Curve.
Although Laffer Curve is a theoretical concept, one of the most famous real-world examples is the Laffer Curve's influence on the tax policies of the United States during the 1980s. In the 1980s, the United States, under President Ronald Reagan, implemented significant tax cuts. These tax cuts were based on the belief that reducing tax rates, particularly for high-income individuals and corporations, would stimulate economic growth and lead to increased government revenue. The Economic Recovery Tax Act of 1981 and the Tax Reform Act of 1986 significantly lowered the top marginal tax rate for individuals, reduced corporate tax rates, and implemented other tax reforms. As a result of the tax cuts, there was a noticeable increase in economic activity. Economic growth and job creation were substantial during the 1980s. While tax rates were lowered, government revenue also increased over the decade. The 1980s experience is often cited as an example of the potential positive impact of reducing tax rates, which aligns with the idea behind the Laffer Curve.
 0:03:35
 0:02:13
 0:03:16
 0:06:21
 0:05:36
 0:06:13
 0:05:00
 0:01:14
 0:00:58
 0:05:37
 0:04:11
 0:02:59
 0:07:48
 0:05:36
 0:08:00
 0:02:35
 0:00:42
 0:03:47
 0:00:54
 0:05:40
 0:07:01
 0:02:37
 0:00:47
 0:01:24