filmov
tv
How to build Interactive Excel Dashboard with Python - Dash

Показать описание
In this tutorial we'll automate your excel reports, using pure Python. We'll use Pandas and Plotly to create the graphs, and we'll go over Dash to build the interactive capabilities. Download the excel sheet below to follow along. I recommend you start a new .py file and write the code with me, as you're going through the tutorial. However, if you're encountering difficulties, feel free to download the full code below.
View my book - The Book of Dash:
Code:
Excel Data:
Plotly Graphs and documentation:
Dash documentation:
Video layout:
00:00 - App demo and what you will learn
01:53 - Getting started (libraries, data)
03:28 - Part 1: Data Exploration with Pandas
07:46 - Part 1: Data Visualization with Plotly
14:26 - Part 2: Interactive Graphing with Dash
23:00 - Part 2: Dash Callback
************************************************************************
👉 Your support keeps Charming Data running, which is proudly a 100% member-supported educational channel:
 0:19:21
📊 How to Build Excel Interactive Dashboards
 0:52:26
Interactive Excel Dashboards & ONE CLICK Update!
 0:05:56
Create an Interactive Excel Dashboard In Under 3 MINUTES!
 0:13:20
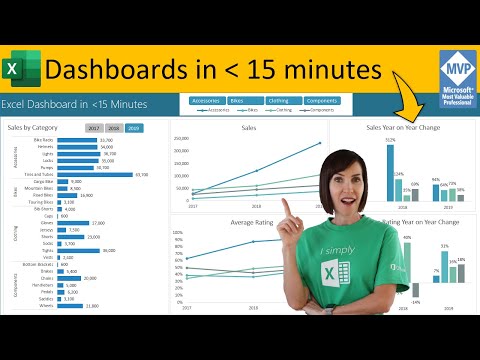
Secrets to Building Excel Dashboards in Under 15 Minutes & UPDATES with 1 CLICK!
 0:28:08
How to make an Excel Dashboard in 5 Easy Steps (Interactive + Free File)
 0:40:04
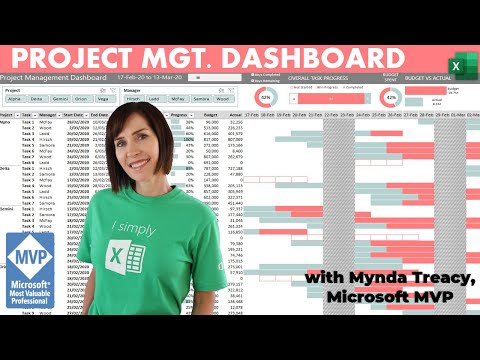
Interactive Excel Project Management Dashboard - FREE Download
 0:40:32
Create interactive excel dashboard in 5 simple steps #exceldashboard #exceltutorial #pivottable
 0:30:37
How to build Dynamic & Interactive Dashboard in EXCEL with Pivot Tables&Charts | Tutorial Ep...
 0:06:50
How to build Interactive Excel Dashboards - Step-by-step Tutorial
 0:54:08
How to Create Impressive Interactive Excel Dashboard | Ultimate Excel Dashboard Ep. 1
 0:13:53
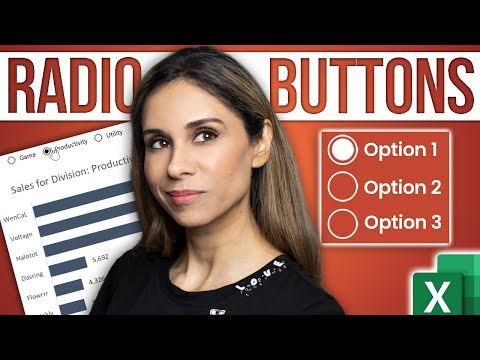
Create INTERACTIVE Excel Dashboards With Option Buttons | How to use Radio Buttons
 0:39:36
How to Build Interactive Excel Dashboards
 0:12:53
🌍 How to make interactive Excel Map charts
 0:25:43
How to build Dynamic & Interactive Dashboard in EXCEL without VBA | Full Tutorial + Voice-over
 1:07:03
Interactive Dashboards in Excel: Microsoft Excel Crash Course
 0:14:03
Beginner's Guide to Excel Dashboards
 0:14:48
Introduction to Pivot Tables, Charts, and Dashboards in Excel (Part 1)
 0:04:42
Make an AWESOME Multi-page Dashboard in Excel with this Trick 💡
 0:41:58
Interactive Personal Finance Dashboard with FREE EXCEL TEMPLATE
 0:26:14
Build Interactive Dashboards in Microsoft Excel
 1:43:18
Full Project in Excel with Interactive Dashboard | Excel Project | Excel Project from Start to End
 0:12:39
Smart Excel Pivot Table Trick - Choose Your KPI from Slicer (Excel Dashboard with DAX)
 0:53:50
Interactive Excel HR Dashboard - FREE Download
 0:00:34
How to Build Interactive Dashboards in Excel 📊 #shorts
Комментарии