filmov
tv
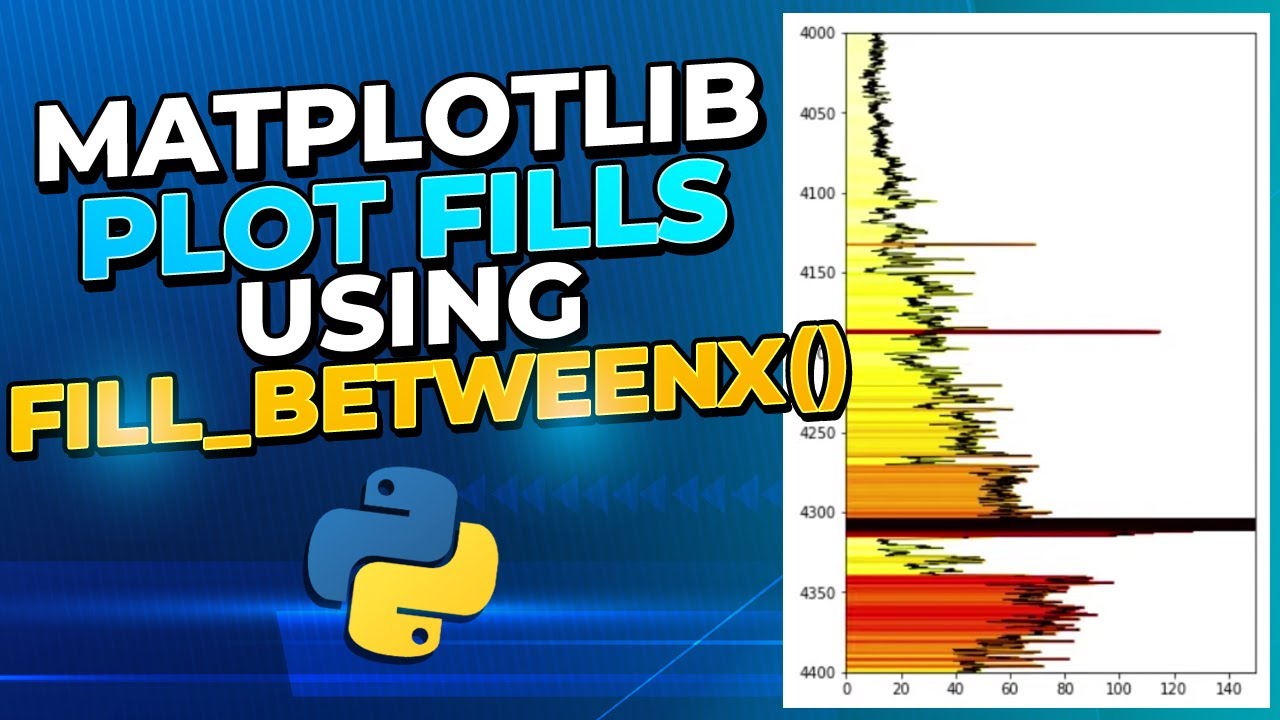
Matplotlib Plot Fills | Applying Shading Between Vertical Curves Using fill between in Python
Показать описание
Applying plot fills to our line plots and well log plots in matplotlib allow us to enhance our data visualization and data interpretation. Within petrophysics and log analysis plot fills are commonly used to identify clean and shaley intervals.
Chapters:
0:00 Introduction
0:41 Jupyter Notebook Section
0:51 Importing Libraries and Data
1:41 Setting up the Line Plot
3:28 Simple Plot Fill to the Left of Plot from a Line
4:16 Fill Both Side of a Line Plot in Different Colors
5:06 Add a Fill to a Fixed Value
6:15 Add a Variable Fill Based on Data Values From the Line to Left of Plot
10:05 Variable Fill to the Right of the Line to Edge of Plot
10:33 Summary
----
Libraries used in this video:
-----
Books I Recommend:
As an Amazon Associate I earn from qualifying purchases. By buying through any of the links below I will earn commission at no extra cost to you.
PYTHON FOR DATA ANALYSIS: Data Wrangling with Pandas, NumPy, and IPython
FUNDAMENTALS OF PETROPHYSICS
PETROPHYSICS: Theory and Practice of Measuring Reservoir Rock and Fluid Transport Properties
WELL LOGGING FOR EARTH SCIENTISTS
GEOLOGICAL INTERPRETATION OF WELL LOGS
-----
Thanks for watching, if you want to connect you can find me at the links below:
#matplotlib #petrophysics #python #histograms #welllogs #jupyternotebooks #geoscience
 0:11:13
Matplotlib Plot Fills | Applying Shading Between Vertical Curves Using fill between in Python
 0:15:18
Matplotlib Tutorial (Part 5): Filling Area on Line Plots
 0:04:27
Fill area of chart using matplotlib in python
 0:06:55
How to add shading to matplotlib figures and fill between two lines || Matplotlib Tips
 0:08:45
Embedding a Matplotlib Graph into a Tkinter application
 0:10:02
Matplotlib Tutorial 12 - more customization of colors and fills
 0:04:17
Add shapes to matplotlib figures with matplotlib patches || Matplotlib Tips
 0:06:38
How to embed Matplotlib Graph in a PyQt5 application
 1:15:38
14. End to End Machine Learning Portfolio Project | MLOps | DVC Pipeline
 0:09:57
Matplotlib Tutorial 22 - cleaning chart, custom fills, pruning
 0:10:24
Matplotlib Plotting Tutorials : 037 : Contour Fill Plot and Tweaks
 0:10:22
Matplotlib Plotting Tutorials : 036 : Contour Plot and Tweaks
 0:13:14
Matplotlib Tutorial 21 - adding more indicator data to our charts
 0:00:14
How to create graphics using Python turtle 🐍🐢 #coding
 0:15:09
plotting maps with geopandas and matplotlib
 0:00:14
Add xkcd comic style in MATPLOTLIB!!
 0:04:36
Vertical and horizontal lines on a chart using matplotlib in python
 0:05:06
Contour Plots in Python | using Matplotlib
 0:56:44
17. Python to make nice figures. Part III: advanced plots
 0:35:01
Matplotlib Tutorial (Part 1): Creating and Customizing Our First Plots
 0:06:09
Developing Advanced Plots with Matplotlib : Putting Lines in Place | packtpub.com
 0:14:49
Matplotlib Tutorial (Part 4): Stack Plots
 0:00:21
Normal People VS Programmers #coding #python #programming #easy #funny #short
 0:14:28
Matplotlib Colormap Tutorial (LinearSegmentedColormap)
Комментарии