filmov
tv
End-To-End Power BI Dashboard Tutorial for everyone | Data Storytelling in 2023 | Data Visualization

Показать описание
▶ Dataset & PBIX file
▶ Evaluate yourself if you can become a successful Business Analyst.
▶ Steps Covered in this Project:
1. Connecting Database with Power BI Desktop. (From CSV file)
2. Creating custom & Calculated columns in the sales table
3. Creating the DATE table
4. Analyzing the tables and relationships
5. Data Cleaning using Power Query Editor with DAX (Data Analysis Expressions).
6. Developing an Interactive Power BI Dashboard / Report.
▶ After watching this video, you will know:
1. How to create Power BI reports in 2023
2. Various PowerBI Concepts
3. Data modelling in the BI tool
4. End-to-end Project in Power BI
▶ TIMESTAMPS:
00:30 Dashboard Overview
02:42 Five Power BI Stages
03:55 Import the Data
06:25 Fact Table vs Dimension Table (Masters)
07:18 Calculated Columns (Using Joins)
12:10 Understanding the datatypes issue
13:40 Working on Power Query Editor
16:45 Create a DATE table
25:40 Total Sales (DAX)
26:40 YTD Sales (DAX)
27:50 LY YTD Sales (Last Year Year-till Date Sales)
29:16 MTD Sales (Month-till Date)
29:50 LY MTD Sales
32:20 YTD Percentage Growth
35:00 Working on the Dashboard
01:03:10 RESET Button (Using Bookmark)
01:05:00 Summary of the steps
01:06:00 Pro Tip for Power BI Users
📁 Data Analyst Resume:
================
Data Analyst Resume with No Work Experience | Step by Step Guide | Templates + Tips + Examples
🛑Data Analyst Journey:
=====================
How I would Study Data Analytics in 2023 (If I had to start over) | Schedule | Salaries | Skill Set?
Timetable And Efficient Strategy to Learn Data Analytics while Working | Improve Productivity
💡 LEARN MORE
========================
💡 LET'S TALK
========================
☮Any specific query? Want to get an Interview ready? Ask me anything!
▶ Data Visualization using Power BI in 2023
▶Data Storytelling in Power BI using various graphs
▶Generate insights from the raw data
#powerbi #powerbitutorial
 1:06:26
Power BI Project End to End Dashboard Development | Beginners | Power BI Tutorial 2024
 1:55:45
Power BI Project End to End | Dashboard | Beginners | Power BI Tutorial 2023
 0:38:22
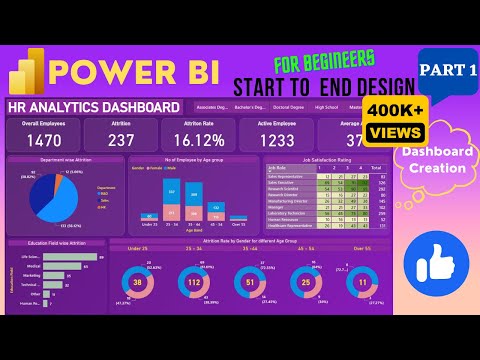
Power BI Dashboard from Start to End (Part 1)| HR Dashboard | Beginner to Pro | Power BI Project
 1:06:44
Power Bi Project End-to-end | Sales Dashboard | Beginners | Complete Project | Resume - 2024
 0:52:19
Power BI Project End to End | Dashboard | Beginners | Complete Project - 2023
 0:27:37
HR Data Analytics & Awesome Dashboard with Power BI 💡: End-to-End Project
 1:09:46
Power BI End to End Dashboard Project | Power BI Project Tutorial | Spotify Dashboard
 0:38:09
Power BI Dashboard For Data Analyst | End-to-End project for Beginners
 3:02:18
Hands-On Power BI Tutorial 📊 Beginner to Pro [Full Course] 2023 Edition⚡
 2:00:15
Power BI End to End Report Development | Dashboard Tutorial 2024 | Beginners Power BI Course 2024
 1:14:22
Build a Power BI Dashboard in 70 min | Power BI Project | End to End | Beginner to Pro | #powerbi
 0:57:03
Power BI Project For Beginners | Power BI Tutorial 2023 | Power BI Dashboard #powerbi
 1:55:34
Amazing Real Time Power BI Project | Start to End Analysis | Power BI For Beginners | Power BI 2024
 0:44:31
Power BI Project End to End | Dashboard | Beginners | @Pavan Lalwani
 1:12:35
End-To-End Power BI Dashboard Tutorial for everyone | Data Storytelling in 2023 | Data Visualization
 1:23:06
Power BI Dashboard Project | Power BI Tutorial for Beginners 2024 | Power BI Course
 0:31:20
Power BI Dashboard Project for Business | Build Step by Step KPI Dashboard
 1:33:00
Power BI Project End to End | Data Analyst Project Portfolio (Part 1) | Dashboard | For Beginners
 0:47:12
End to End Power BI Project | Dashboard | Complete Project - 2023
 0:35:40
End to End Project- Power BI | Superstore Analytics Dashboard | Complete project - 2024
 0:16:22
Sales Dashboard in Power BI | Power BI Dashboard
 0:53:05
Power BI Dashboard | Power Bi Project - Sales Dashboard | Power Bi Tutorial for Beginners
 0:55:13
Power BI HR Dashboard Tutorial for Beginners- End To End Project 2024 | Power BI Tutorial
 1:37:25
End to End Data Analytics Project | Power BI Project | Hospitality Domain
Комментарии