filmov
tv
QGIS lesson 27 – Creating a choropleth / heat map

Показать описание
In this lesson I will show you how to create a choropleth or heat map based on data from the US Census Bureau
You will learn how to
• Write simple excel formula to join two columns
• Import a csv into QGIS to perform a data join with a shapefile
• Create a graduated choropleth with Jenks distribution
• Create 3 views of your map in print composer
US counties shapefile
US poverty data
You will learn how to
• Write simple excel formula to join two columns
• Import a csv into QGIS to perform a data join with a shapefile
• Create a graduated choropleth with Jenks distribution
• Create 3 views of your map in print composer
US counties shapefile
US poverty data
 0:12:44
QGIS lesson 27 – Creating a choropleth / heat map
 0:13:56
Batch Processing in QGIS # Lesson 27 of 29 # QGIS Tutorial.
 0:03:27
Lecture14 # create multiple shapefile by attribute using QGIS 2023 02 27
 0:04:26
#27 QGIS - How to make a simple, easy and quick sketch
 0:23:36
Creating Flow Maps in QGIS # Lesson 26 of 29 # QGIS Tutorials.
 0:03:00
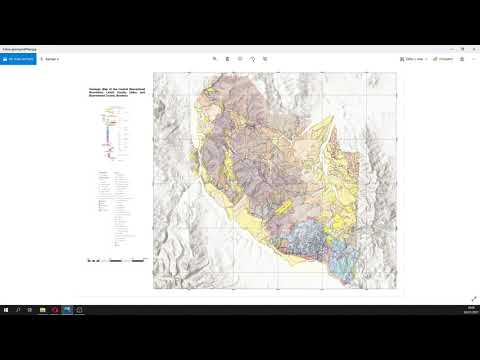
Intro to open webinar: How to make a geological map with QGIS - Apr 27-29 2021
 0:16:13
QGIS Tutorials 27: How to Symbolize polygon Layer in QGIS | Beginners | QGIS 3.22 | Single Symbol
 0:09:07
QGIS lesson 28 – Creating a choropleth/heat map, part 2
 0:03:52
QGIS Basics #27: Answer to the question about QGIS 2.18.24 Difference Function
 0:01:40
#27 QGIS Vector | Clip
 0:18:45
Generating XYZ tiles(MBTiles) in QGIS # Lesson 28 of 29 # QGIS Tutorial.
 0:03:42
QGIS lesson 20 – Adding gridlines to your globe
 0:12:43
QGIS lesson – Creating a choropleth heat map
 0:32:59
QGIS 3 for Absolute Beginners
 0:27:30
Radial Flow Maps using QGIS
 0:09:32
QGIS lesson 19 – Creating a globe projection
 0:04:16
QGIS lesson 23 – Creating SVGs that are editable in QGIS
 0:20:27
Make Qgis maps that standout (No one will teach you this 😎)
 0:22:21
Symbology in QGIS # Lesson 5 of 29 # QGIS Tutorial.
 0:06:53
Tutorial 27: Importing GPS data to QGIS as GPX, CSV or KML
 0:17:01
Adding Geotagged Photos in QGIS # Lesson 29 of 29 # QGIS Tutorial.
 0:07:06
QGIS lesson 18 – Creating SVG marker in Illustrator and adding to OpenStreetMap in QGIS
 0:07:21
QGIS lesson 04 – Styling the map
 0:14:00
Creating a map using QGIS
Комментарии