filmov
tv
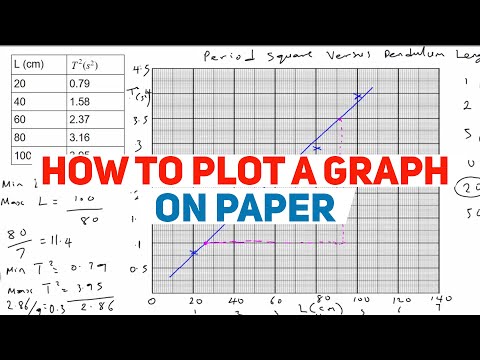
How to Plot a Graph in Physics Practicals || Class 12 Physics

Показать описание
Welcome to our YouTube video on mastering the art of plotting graphs in physics practicals. Graphs are powerful visual tools that help us analyze and interpret experimental data. In this video, we will guide you through the process of plotting accurate and informative graphs, enabling you to excel in your physics practicals. Join us as we unravel the secrets behind graphing and learn how to effectively present your experimental results.
Part 2: Overview of the Topic
Plotting graphs in physics practicals is a crucial skill that allows us to visually represent the relationship between variables and observe trends and patterns in experimental data. In this video, we will cover the essential steps involved in graphing, including selecting appropriate axes, labeling, scaling, plotting data points, and drawing a best-fit line or curve. By following these steps meticulously, you can enhance the clarity and accuracy of your graphs, making them a powerful tool for analysis and interpretation.
Part 3: Detailed Explanation and Keyword Integration
Let's dive deeper into the process of plotting a graph in physics practicals:
Selecting Axes and Labels: The first step is to determine the dependent and independent variables and assign them to the appropriate axes. We will discuss the importance of labeling the axes with the corresponding quantities and their units to ensure clarity and consistency.
Scaling and Plotting Data Points: Proper scaling is crucial for maintaining proportionality in the graph. We will explore different scaling techniques, including linear, logarithmic, and semi-logarithmic scales, depending on the nature of the data. We will also demonstrate how to plot individual data points accurately.
Drawing a Best-Fit Line or Curve: In many cases, experimental data exhibits a trend that can be represented by a line or curve. We will guide you through the process of drawing a best-fit line or curve that captures the overall trend of the data, enabling you to analyze and interpret the results effectively.
By mastering the art of plotting graphs in physics practicals, you will not only enhance your data analysis skills but also improve your chances of scoring well in your examinations. Follow the techniques and tips shared in this video to present your experimental data in a visually appealing and scientifically rigorous manner.
Don't forget to like, subscribe, and hit the notification bell to stay updated with our informative videos on physics practicals and related topics. Together, let's sharpen our graphing skills and unlock the true potential of experimental data.
[Keywords: How to plot a graph, How to draw a graph, How to plot a graph for physics practical, Graph in physics practical, Graph in practical, Graph practical class 12, Graph practical physics class 12, Physics practical, Physics practical class 12, Class 12 physics practical, Practical physics class 12 2023, Class 12 practical physics, How to get full marks in physics practical, Physics practical paper pattern, Paper pattern of physics practical, Practical physics 2023]
 0:05:42
How to Plot Points a Coordinate Plane | Positive and Negative Coordinates | Math with Mr. J
 0:02:36
How To Make A Line Graph In Excel-EASY Tutorial
 0:05:57
Drawing Linear Graphs
 0:10:14
Algebra Basics: Graphing On The Coordinate Plane - Math Antics
 0:10:25
How to Plot a Graph on Paper in Science
 0:06:11
How to Plot a Graph on Word
 0:02:39
How to Draw a Graph - WORKED EXAMPLE - GCSE Physics
 0:06:45
GCSE Maths - How to Plot a Straight Line Using a Table of Coordinates #70
 0:03:04
How to make a bar graph in Google Docs
 0:19:52
Practical Physics (PHY 107): How to Plot a Graph Within 5 Minutes
 0:01:57
Plot Multiple Lines in Excel
 0:14:06
HOW TO PLOT A GRAPH | PHYSICS PRACTICAL | MATHEMATICS
 0:05:28
GCSE Maths - How Do You Plot A Quadratic Curve? #77
 0:02:09
How to Plot on Graph Paper : Easy-to-Intermediate Math
 0:18:54
HOW TO PLOT A GRAPH IN PHYSICS PRACTICAL
 0:07:09
How to make a scientific graph in Excel
 0:05:39
Graphing Data by Hand
 0:04:24
How to pick the best scale for a graph
 0:05:25
How to Make a Line Graph in Excel
 0:05:15
Solving Systems of Equations By Graphing
 0:04:17
Plot Straight Line Graphs | Graphs | Maths | FuseSchool
 0:01:34
How to Create a Graph in Excel
 0:04:52
How To Plot Points on a Graph
 0:05:35
Drawing Line Graphs
Комментарии