filmov
tv
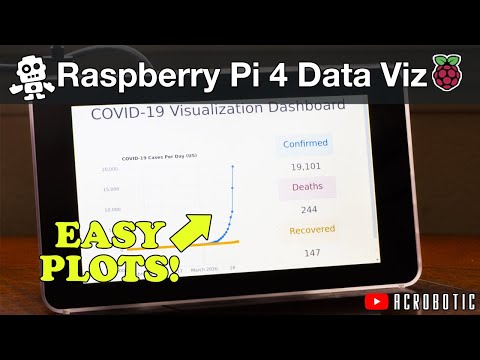
Raspberry Pi 4 Data Visualization GUI On 7' Touchscreen Display | FullPageOS

Показать описание
• Your support helps me post videos more frequently:
BTC: 1ZpLvgETofMuzCaKoq5XJZKSwe5UNkwLM
==========
• Find me on:
==========
• My shops:
==========
• Description:
In this video, I go over the process of building a Data Visualization display using a Raspberry Pi and a 7-inch Touchscreen Display. I show, step-by-step, the assembly of the hardware as well as the necessary software for having the Raspberry Pi run a fullscreen webpage right after booting up. I also detail a custom webpage that uses JavaScript and the Google Charts API to plot data. Lastly, I outline the code in a Python script for querying an API in order to fetch the data needed to generate the visualizations.
==========
• Related vids:
==========
• Project code:
==========
• Music:
==========
#RaspberryPi #RaspberryPi4 #Tutorial
 0:10:45
Raspberry Pi 4 Data Visualization GUI On 7' Touchscreen Display | FullPageOS
 0:03:37
How to visualize data with KIBANA on Raspberry Pi?
 0:22:57
Pandas & Raspberry Pi Data Analysis
 0:10:41
Raspberry Pi 4 LIDAR Data Visualization | Python, Plotly, Websockets, D3.js
 0:13:27
BNO055 9 Axis Inertial Measurement Unit's Data Visualization using python and Raspberry Pi Zero...
 0:20:17
Data Visualization using Losant IoT and Raspberry Pi
 0:45:42
Fast Raspberry Pi 4 Telemetry and Data Visualization
 0:01:42
Arm Global Data Visualization {showcase} @ARMTechCon 2017
 0:52:16
Data Visualization with Raspberry Pi
 0:22:01
Visualizing Humidity Data with Raspberry Pi | Python & Flask Tutorial
 0:04:01
Raspberry Pi demo realtime sensor data analysis (english)
 0:01:16
using the InfluxDB on Raspberry Pi 3B+ using it for visualization on Graphana nad Chronograf.
 0:06:15
E-ink Weather Dashboard with a Raspberry Pi
 0:02:14
MQTT on Raspberry Pi (part 2): Visualize Sensor Data on a TilesFX Dashboard
 0:24:48
Sense and Visualize data with Arduino & Raspberry for Internet of Things
 0:14:18
Raspberry Pi Tutorial: Read Temp and Humidity with Python and DHT11
 0:00:56
Real time data visualizer using Raspberry Pi Plotly API
 0:42:15
Integrating Raspberry Pi Sensors with Data Visualization
 0:09:51
Raspberry PI4 Dashboard using Grafana, Python and InfluxDB - Part 2
 0:12:32
Raspberry Pi IoT Server Tutorial: InfluxDB, MQTT, Grafana, Node-RED & Docker
 0:05:53
Data Collection and Visualization from your IoT eScooter w/ SORACOM and Raspberry Pi (Pt 2)
 0:02:51
How to Send Your Raspberry Pi Data to Arduino Cloud
 0:46:35
Visualizing Aircraft Data: Oracle IoT Cloud Service, Raspberry Pi, and Radio Surveillance
 0:02:05
Dash on Raspberry PI: creating web apps and graphs from python data
Комментарии