filmov
tv
Fast Raspberry Pi 4 Telemetry and Data Visualization

Показать описание
The latest version of Telemetry Viewer now works on the Raspberry Pi 4! This video covers all of the new features I added:
- Webcams and network cameras (MJPEG over HTTP.)
- Initial support for the Raspberry Pi 4 (mostly working, but reduced functionality.)
- A new "timeline" feature makes it easy to jump or scrub through lots of data.
- Time domain charts can now show timestamps (date and time) along the x-axis.
- Bitfield (boolean and enum) "levels" can now be visualized as bars drawn on top of the charts (similar to a logic analyzer.)
- Timestamps can be shown in any of the common formats: YYYY-MM-DD, MM-DD-YYYY and DD-MM-YYYY.
- Most of the OpenGL and chart code has been rewritten, resulting in massive speed improvements. CPU and GPU usage is often cut in half. When using Nvidia GPUs the GPU usage has been cut down by almost 80%!
- Progress bars are now displayed when importing and exporting data.
- Finally works in Java 9+.
The video starts by demoing the new features with my balancing robot. I have a Flir E4 thermal camera monitoring temperatures, and an old smartphone setup as a network camera. Telemetry Viewer shows both camera feeds, plus all of the normal telemetry data, making it easy to correlate between them.
After that, I demonstrate how to use the software from beginning to end. Both the CSV and binary modes are explained.
Finally, I demo how to use the software on the Raspberry Pi 4. I recommend using the "Ubuntu MATE 20.04 32-bit" image because it includes a version of Mesa that supports geometry shaders. When I recorded this video, the version of Mesa in Raspberry Pi OS is older and does not support geometry shaders. If you use Raspberry Pi OS, you will need to download/compile/install Mesa, which can be difficult if you are not familiar with that process. I cover how to do that on my website (link below.)
Download:
More details about how to use it on the Raspberry Pi 4:
If you find this software useful and would like to "buy me a coffee" that would be awesome:
You can also support development of this software by ordering items from Amazon through my affiliate links. There is no added cost for you, but Amazon sends me a small commission.
If you are curious about the balancing robot shown in this video, I have a whole series of videos where I show that entire process from beginning to end:
 0:45:42
Fast Raspberry Pi 4 Telemetry and Data Visualization
 0:25:22
Faster Telemetry and Data Visualization from Multiple Connections
 0:01:52
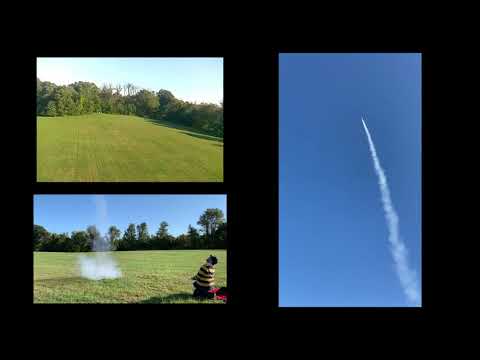
Rocket with Onboard Raspberry Pi Telemetry
 0:02:08
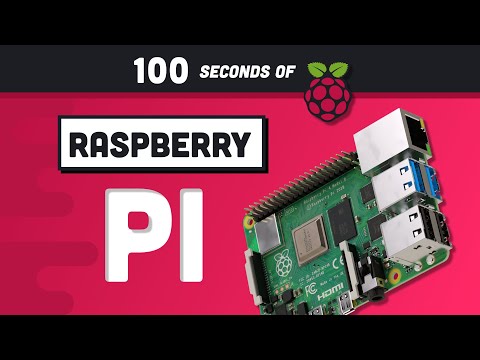
Raspberry Pi Explained in 100 Seconds
 0:02:14
F1 Telemetry on Raspberry Pi
 0:02:54
Raspberry Pi power module 24v to 5v convertor unlimited 4g telemetry
 0:04:28
Recruit Wing with PX4 Telemetry Using Raspberry Pi Zero, GSM Module, and Hologram IoT Network
 0:15:11
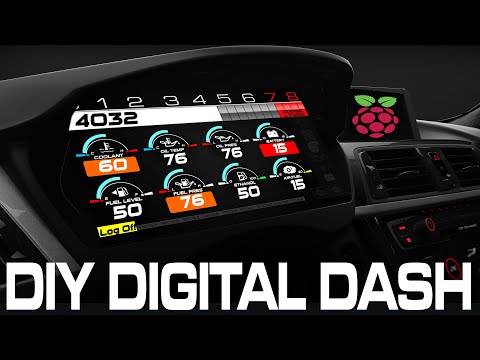
DIY Raspberry Pi Racecar Dashboard: The Ultimate Guide
 0:00:21
ETS2 + Raspberry Pi 1 with 16x2 LCD
 0:10:42
Test & Tune Pi Telemetry
 0:07:52
Raspberry Pi Powered Rocket Telemetry Launch October 9, 2021
 0:20:43
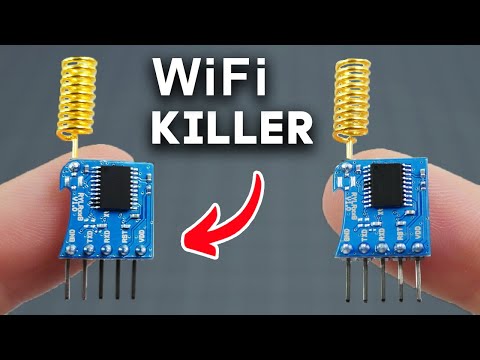
You’ve Never Seen WiFi Like This
 0:01:05
ControlMyPi Bicycle Telemetry System
 0:04:38
Raspberry Pi vs Rock 4 C Plus
 0:00:52
Unbelievable Speed: Fastest Line Follower Moments from Technoxian 7.0
 0:02:19
Telemetry Viewer
 0:00:48
3G telemetry on ArduPilot 2.6 (APM) via a Raspberry PI (RPI)
 0:00:56
Raspberry PI Pico and Pico W. Moving STDIO UART to different PINS
 0:18:24
Waveshare SIM7600G-H 4G HAT for Raspberry Pi - Unlock Mobile Connectivity and GPS!
 0:00:20
The Cheapest long Range Arduino Nano Mini Drone #shorts #drone #arduino #viral #diy
 0:06:54
Sensor Telemetry
 0:09:56
How to Send Custom Sensor Data | Meshtastic for Makers
 0:00:15
Radxa Rock Pi 4 B Computer #shorts
 0:00:25
ArduPilot Mega 2.5board with RX and Telemetry TX
Комментарии