filmov
tv
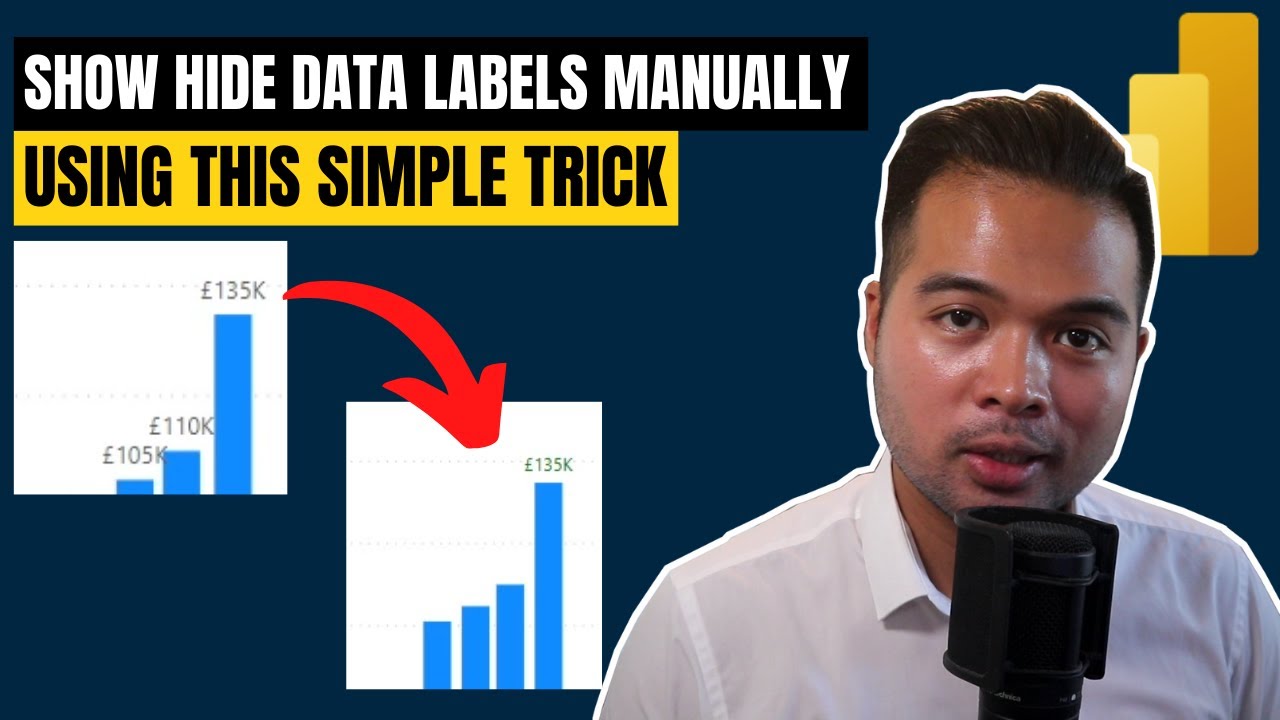
EASY WAY to SHOW / HIDE Data Labels in Power BI // Beginners Guide to Power BI in 2022
Показать описание
In this video we look at how you can use conditional formatting to show or hide data labels and control them using DAX to show the highest, lowest or even topn values
-
🚩 Get Demo Files here
👍 Become a Patreon to support the channel and get free perks!
🛍 Get exclusive templates built using best practices here
❤ Other ways to support
GET IN TOUCH
🌍 WHO IS SOLUTIONS ABROAD
Hi, my name is Fernan, the one-man band of Solutions Abroad. I work as a Data Scientist based in London, UK and have over 6 years of experience working in Business Intelligence. Solutions Abroad these days is dedicated to teaching the ins and outs of Power BI, through the power of YouTube.
If you want to learn more, I’ve conveniently created playlists to help you find the right topic for you.
🐎 First, watch this video about how a typical Power BI workflow looks like
🗺 Learn DAX to extend your Power BI calculations
📆 Stay up-to-date on all the features Power BI releases monthly
🧪 Get certified as a Microsoft Data Analyst Associate
💡 Learn Power BI Features to improve your dashboards
📊 WHAT IS POWER BI?
Power BI is a business analytics tool by Microsoft. It creates a working environment suited for normal users, meaning tasks such as data extraction, cleansing, analysis and storytelling; these are made easily-accessible to citizen-users, and extendable for technical users. At face value it provides visually-stunning, interactive dashboards, but it’s built on top of so much more.
🔻 Get started with Power BI Desktop for FREE
#PowerBI #DataAnalytics #BusinessIntelligence
 0:00:34
The Easy Way to Show Battery Percentage on Your Google Pixel Phone!
 0:02:42
Easy Way to Throw a Cast Net! Throwing The Easy Way!
 0:02:41
Easy Way to See Your Password Hidden Behind the Asterisks or Dots
 1:03:20
Break This Ball in 1 Minute, Win $1,000!
 0:00:16
Easy way to draw anime face!!🔥 (Front view head tutorial) #howtodraw
 0:02:43
How to find out Percentage from Calculator Easy Way
 0:00:48
How To Learn TikTok Dances Easy *FASTEST WAY - LEARN IN 5 MINS*
 0:00:46
How to Cook Quinoa (the easy way)
 0:11:49
The Easy Way to Make Delicious Local Food with Buttermilk
 0:02:40
Easy Way To Learn The 9 Times Multiplication Table-Math Trick
 0:01:00
Butch Harmon Shows an Easy Way To Hit Better Chip Shots | Chipping Tips | Golf Digest
 0:55:36
Surviving the WORLD'S TINIEST HOUSE for Daughter
 0:00:41
Easy Way to Draw a Hand! ✋
 0:04:50
HOW TO BAR LACE NIKE AIR FORCE 1s (EASY Way)
 0:02:09
Dolly Jain's EASY Way to Saree Draping Without Fuss!
 0:07:14
How to Polish a Car Polish THE EASY WAY without a Machine Polisher?
 0:03:25
How to Calculate Present Value on Calculator - Easy Way
 0:02:24
Easiest Way to Make a Hair Scrunchie - EASY DIY sewing project
 0:05:11
The Fastest “No” Dave Ramsey Has Ever Given on the Show
 0:25:02
Giant Game of Clue in Detention
 0:05:57
Easy Way To Market Yourself and Why You Should Do It - Tell Your Story Part 1
 0:04:14
An amazing easy way to sew a handmade turban hat!
 0:03:44
Easy Way to Hem Pants and Keep the Original Seam Showing
 0:02:51
GO SEAMLESS!! Crochet Invisible join the easy way.
Комментарии