filmov
tv
#1 TYBMS NETWORK ANALYSIS III | PERT |Operation Research | | SIRAJ SHAIKH

Показать описание
Hello ...... Today We Will learn basic concepts of network scheduling or project management. In this video first we learn Operational Reserch network analysis I
basic terms : activities, events
common Error: looping, dangling, redundancy
Rule to draw network diagram
numbering the events : Fulkerson's rule
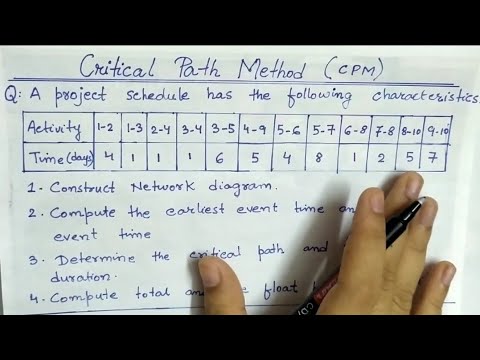
construction of network diagram
Time analysis: Forward pass computation
Backward pass computation
calculation of float and slack
Critical Activity
critical path
CPM (critical path method)
PERT ( program evaluation and review techniques)
A network diagram is a graphical representation of all the tasks, responsibilities and work-flow for a project. It often looks like a chart with a series of boxes and arrows.
i just hope you all must have liked the video, so do comment your view and do like and share the channel if you all feel worth sharing the channel.
Don’t forget to subscribe our channel
Must check playlist for all other videos. ❣️
Like, share or subscribe karna mat bhulna..!!!
For notes and important questions join our telegram channel :
Telegram : skyeducationofficial
(in case of link failure just search by name)
Connect with me on all other social media networks
Facebook : siraj shaikh
Instagram : sam4sir00
Twitter : sirajsam4sir
Snapchat : sam4sir (siraj shaikh)
Telegram : sam4sir00
#sirajshaikh #mumbaiuniversity #tybcom #tybms
basic terms : activities, events
common Error: looping, dangling, redundancy
Rule to draw network diagram
numbering the events : Fulkerson's rule
construction of network diagram
Time analysis: Forward pass computation
Backward pass computation
calculation of float and slack
Critical Activity
critical path
CPM (critical path method)
PERT ( program evaluation and review techniques)
A network diagram is a graphical representation of all the tasks, responsibilities and work-flow for a project. It often looks like a chart with a series of boxes and arrows.
i just hope you all must have liked the video, so do comment your view and do like and share the channel if you all feel worth sharing the channel.
Don’t forget to subscribe our channel
Must check playlist for all other videos. ❣️
Like, share or subscribe karna mat bhulna..!!!
For notes and important questions join our telegram channel :
Telegram : skyeducationofficial
(in case of link failure just search by name)
Connect with me on all other social media networks
Facebook : siraj shaikh
Instagram : sam4sir00
Twitter : sirajsam4sir
Snapchat : sam4sir (siraj shaikh)
Telegram : sam4sir00
#sirajshaikh #mumbaiuniversity #tybcom #tybms
 0:41:18
#1 TYBMS NETWORK ANALYSIS III | PERT |Operation Research | | SIRAJ SHAIKH
 0:30:35
#1 TYBMS NETWORK ANALYSIS III | PERT |Operation Research | | SIRAJ SHAIKH
 1:03:58
#1 TYBMS NETWORK ANALYSIS | How To Draw Network Diagram In Operation Research | CPM | SIRAJ SHAIKH
 0:22:29
#1 TYBMS NETWORK ANALYSIS | How To Draw Network Diagram In Operation Research | CPM | SIRAJ SHAIKH
 0:35:58
Network Analysis | Critical Path | EST,EFT,LST,LFT | FLOAT |Operation Research | Dr. Mihir
 1:12:23
#2 TYBMS NETWORK ANALYSIS | EST EFT LST LFT TF FF HS TS |Operation Research | CPM | SIRAJ SHAIKH
 0:27:46
#2 TYBMS NETWORK ANALYSIS III | PERT |Operation Research | | SIRAJ SHAIKH
 0:26:31
Network Analysis - PERT | Programme Evaluation and Review Technique |Operation Research | Dr. Mihir
 0:21:01
Part-3. Network analysis-1|| Critical Path Method (CPM) || TYBMS OR
 0:00:16
Most💯 Important Step Before any Procedure 🔥
 0:35:30
#3 TYBMS NETWORK ANALYSIS | How To Draw Network Diagram In Operation Research | CPM | SIRAJ SHAIKH
 0:18:01
total float | free float| independent float|interference float| network analysis|| pert and cpm
 0:26:16
PERT | Calculate the project variance | Program Evaluation and Review Techniques
 0:28:49
Lec-38 Program Evaluation And Review Technique In Hindi | PERT in Operation Research
 0:28:24
Drawing Network Diagram | Network Analysis | Critical Path Method | Operation Research | Dr. Mihir
 0:46:35
#3 TYBMS NETWORK ANALYSIS II | PROJECT CRASHING EASY WAY |Operation Research | SIRAJ SHAIKH
 0:31:38
#1 TYBMS NETWORK ANALYSIS II | PROJECT CRASHING EASY WAY |Operation Research | SIRAJ SHAIKH
 0:07:32
Part-2. Network analysis-1|| Critical Path Method|| OR(TYBMS)
 0:35:23
Lec-37 Critical Path Method In Operation Research | In Hindi
 0:21:21
#2 TYBMS NETWORK ANALYSIS | How To Draw Network Diagram In Operation Research | CPM | SIRAJ SHAIKH
 0:31:49
Network Analysis - PROJECT CRASHING | Operation Research | Dr. Mihir
 0:26:29
#2 TYBMS NETWORK ANALYSIS III | PERT |Operation Research | | SIRAJ SHAIKH
 0:18:11
#1 -Drawing Network diagram - Under Network analysis - by Dr. Mihir Shah
 0:36:49
Lec-35 How To Draw Network Diagram In Operation Research | Concept of Network Scheduling | Hindi
Комментарии