filmov
tv
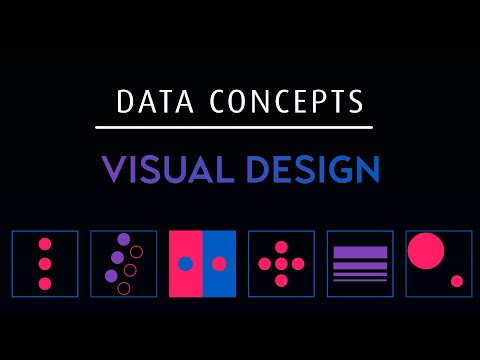
Data Viz Tip - Visualize Proportions To Reinforce Ideas

Показать описание
Take advantage of the “visual” part of data visualization by using proportion to reinforce ideas in your charts and infographics.
It’s simpler than it sounds! Learn how you can use visuals to support your message in today’s VB video lesson.
Subscribe to our channel for more clips about data visualization and storytelling, and sign up for our newsletter or read our blog for the latest on presentation design and more.
📍 FOLLOW US
We regularly share high-quality content that you can actually use
🏅 DOWNLOADS
Check out our resource guides for in-depth strategies and more
📝 POPULAR CONTENT
Read some of our favorite blogs on our site
👋 ABOUT US
VerdanaBold is a presentation design, storytelling, and training agency. We believe that anyone can learn the skills of quality communications and give better presentations.
Our clients include Fortune 500 companies, growing startups, global agencies, and more. We use our extensive experience in creating presentations to give you simple, actionable tools for communicating better and improving your slides.
 0:17:11
 0:04:17
 0:09:51
 0:03:56
 0:08:00
 0:11:02
 0:09:05
 0:07:32
 0:08:00
 0:04:47
 0:07:59
 0:00:25
 0:25:57
 0:03:09
 0:06:49
 0:14:17
 0:02:09
 0:00:42
 0:00:06
 0:11:59
 0:09:49
 0:00:41
 0:00:13
 0:12:14