filmov
tv
How to perform a QTL analysis using the qtl package in R and plot the results (2 or more phenotypes)

Показать описание
This video shows you how to perform a QTL analysis using the program R.
There is a second part to this video, which can be found here:
This tutorial assumes you already have the following programs installed:
These programs are free of charge and can be installed on a Windows, Mac, or Linux (for instance, Ubuntu) machine.
Furthermore, this video assumes you have already installed the following R libraries: lme4, qtl, devtools, and qtlTools.
This video illustrates how to perform the analysis using a Mac, but it should work exactly the same on a Windows machine, as well as on a Linux machine (assuming you have properly installed the packages on your Linux machine).
The files utilized in this tutorial can be downloaded below. Be sure to unzip the files first, and keep them together in the same folder.
 0:11:05
QTL Analysis Explanation and Example
 0:05:01
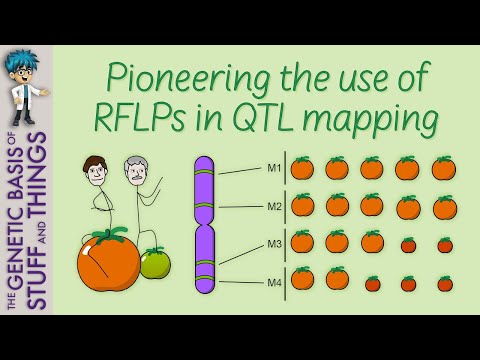
Understanding Quantitative Trait Loci with the help of tomatoes
 1:07:31
Webinar #1 - Introduction to Quantitative Trait Loci (QTL) Analysis
 0:02:40
Quantitative trait loci (QTLs)
 0:09:56
QTL and QTL Mapping
 0:09:09
QTL analysis using Q gene software
 0:24:48
How to perform a QTL analysis using the qtl package in R and plot the results (2 or more phenotypes)
 0:02:51
Quantitative Trait Locus Mapping | QTL Mapping | QTL Trait Analysis |
 0:06:15
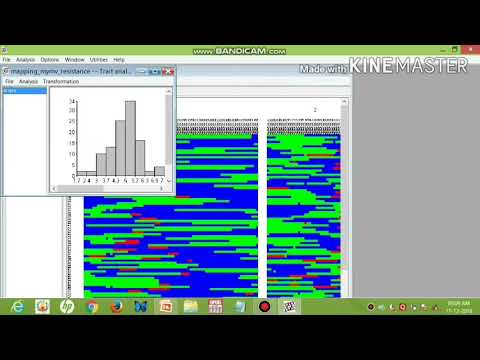
QTL Mapping of MYMV resistance in Mungbean using GBS platform
 0:53:10
How to perform a QTL power analysis in R
 0:09:15
QTL Mapping
 0:08:47
QTl and GWAS
 0:11:02
Taagen: Dissecting yield: Fine-mapping grain weight and shape QTL in spring wheat
 0:52:44
MPG Primer: Introduction to expression quantitative trait loci (2021)
 0:04:24
QTL analysis in Genstat: part 1
 1:16:23
Linkage Analysis and QTL Mapping in Tetraploids
 0:28:07
Genome sequence and QTL identification for major agronomic traits of mungbean (Vigna radiata)
 0:37:23
Tools for Polyploids Workshop: Overview of QTL Analysis (01 15 2021)
 0:08:47
QTL cartographer
 0:14:31
QTL Mapping
 0:13:56
Genetic mapping and QTL analysis of the sex locus in tetraploid kiwiberry (1/12/2023)
 0:18:07
NCBI Molecular QTL resource
 0:19:02
Linkage Mapping - QTL Mapping- using R statistical software
 0:41:36
Genetic and QTL analysis for Kernel Iron and Zinc concentrations in Groundnut
Комментарии