filmov
tv
R vs Python ANOVA Interaction Plot

Показать описание
^Downloadable code & more! ANOVA Interaction plots
In python we will read it in using pandas dot read_csv we will use a regular expression to operate by space so slash s plus.
And here is what the data looks like in python. Let me go back over here to R to show you what the data looks like in R as well. And lets delete those now that we have seen that it read the data in correctly for both languages.
Now before we continue by making sure the gender is a factor. In R we will just resign the column using the factor function.
In Python we will use the dot as type string to make sure it uses the values in gender as a category and not a numerical value.
Now we are read for the interaction plots. In R we do interaction dot plot In this example we will do type first, then second comes the numerical score value, in this case days, and last is our other categorial variable, so gender.
And there is the plot in R. It defaults to this black and white, with a legend.
In Python we do interaction underscore plot. The order in python is a bit different than R. We will put our categories both first and then the numerical days at the end. So type, gender, and lastly days.
And there is the interaction plot between Type and gender in python. This defaults to red and blue with a legend as well.
In python there are a lot of customizations you can do to this plot. Let’s take a look at those by bringing up the documentation. So interaction_plot ? . You can change line style and colors. If you want… and I may or my not have done this for fun before, you can make it look exactly like R’s default interaction plot output.
So there you have it that is how you can create Analysis of Variance Interaction plots in both Python and R. Explosion at beginning is from the Mask of Zorro.
Be sure to watch some of my other python videos, and don’t forget to hit subscribe. :D
This is a Python anaconda tutorial for help with coding, programming, or computer science. These are short python videos dedicated to troubleshooting python problems and learning Python syntax. For more videos see Python Help playlist by Rylan Fowers.
#PythonMarathon #LearnPython #PythonTutorial
 0:04:19
R vs Python ANOVA Interaction Plot
 0:03:47
R vs Python ANOVA Type 1
 0:05:08
R vs Python ANOVA Type 3
 0:04:46
R vs Python ANOVA Histogram of Residuals
 0:00:18
Conduct an one-way anova in R
 0:07:58
Analysis of Variance (ANOVA) in R
 0:03:00
l'ANOVA en 3 minutes ;-)
 0:12:16
R programming at work: How to perform ANOVA analysis of variance Hypothesis testing
 0:07:23
GLM Part 6: Interaction effects: How to interpret and identify them
 0:12:20
Don’t Ignore Interactions - Unleash the Full Power of Models with {emmeans} R-package
 0:01:09
Reporting Mixed ANOVA - results from R
 0:13:29
What is ANOVA (Analysis of Variance) in Statistics ? | Explained with Examples (ANOVA F - test)
 0:13:40
Pre-Lab ANOVA Analysis: Three-Way ANOVA in R
 0:08:09
Fixed and random effects with Tom Reader
 0:07:35
ANOVA using R Programming | Bakery Case Study | Tukey's Test | Ujjyaini | IvyProSchool
 0:04:23
21. ANOVA: Interaction in Linear regression
 0:15:31
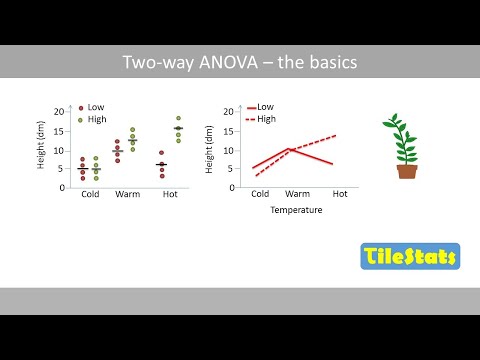
Two-way ANOVA - the basics | interaction | two-way vs one-way
 0:02:18
Three-Factor ANOVA
 0:06:45
30. Two Way ANOVA in Python || Dr. Dhaval Maheta
 0:19:01
R or Python: Which Should You Learn?
 0:07:23
TWO-WAY ANOVA IN PYTHON
 0:07:35
ANOVA using R Programming | Bakery Case Study | Tukey's Test | Ujjyaini | Re Live | IvyProSchoo...
 0:08:06
independent groups ANOVA in R
 0:01:48
Mixed ANOVA in R - Checking Homogeneity of Covariance Matrices
Комментарии