filmov
tv
Effective Use of Graphs- Data Visualization, Part 1

Показать описание
How can you tell a compelling story with your data? Some basics on 2D plotting and presentation.
► Dr. Shane Ross is a Professor of Dynamical Systems at Virginia Tech. He has a Ph.D. from Caltech (California Institute of Technology) and worked at NASA/JPL and Boeing. See more of his research and courses at @ProfessorRoss
► Courses & Playlists by Dr. Ross
📚Attitude Dynamics and Control
📚Nonlinear Dynamics and Chaos
📚Hamiltonian Dynamics
📚Three-Body Problem Orbital Mechanics
📚Lagrangian and 3D Rigid Body Dynamics
📚Center Manifolds, Normal Forms, and Bifurcations
► References
Book: Nathan Kutz, Data-Driven Modeling & Scientific Computation
Book: Stephanie Evergreen, Effective Data Visualization: The Right Chart for the Right Data
#Plotting #DataViz #Graphs #DataVisualization #BigData #plotting #excel #matlab #bargraph #linegraph #charts
 0:05:03
How To Choose The Right Graph (Types of Graphs and When To Use Them)
 0:05:12
Effective Use of Graphs- Data Visualization, Part 1
 0:07:32
7 Effective Tips for Presenting Data at Work!
 0:13:01
Top 5 Most Common Graph Algorithms for Coding Interviews
 0:07:48
Module 4 – Section 1: Effective Use of Tables and Graphs
 2:12:19
Graph Algorithms for Technical Interviews - Full Course
 0:00:22
Easy AI Tool for Charts and Graphs 📊
 0:12:39
Math Antics - Data And Graphs
 0:01:06
Bar graphs, pie charts, and powerful data! 📈📊
 0:18:31
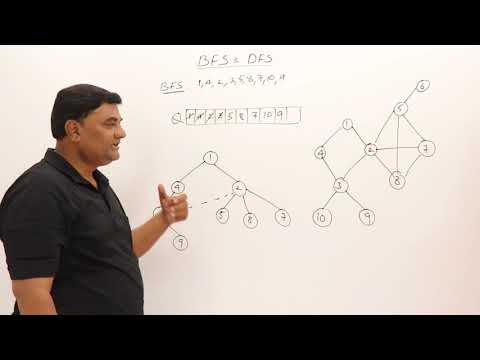
5.1 Graph Traversals - BFS & DFS -Breadth First Search and Depth First Search
 0:03:12
Types of Graphs and when to use them
 0:00:11
Add data to chart in excel #exceltips #exceltutorials #charts
 0:24:31
Excel Charts and Graphs Tutorial
 0:12:06
Line Graphs - Data Communication / Data Visualization
 0:00:15
Easy Way To Create And Add Data To Graph
 0:04:47
Telling Stories with Data in 3 Steps (Quick Study)
 0:00:23
How to create an s-curve combo chart in #excel #exceltips #exceltricks
 0:16:26
Introduction to Graph Theory: A Computer Science Perspective
 0:00:59
How I Tricked ChatGPT into Analyzing MASSIVE Datasets (100% Free)
 0:04:24
AI Explained - Knowledge Graphs | Turning Raw Data Into Useful Information
 0:01:01
Don't Create Boring🥱 Charts‼️Instead Use Amazing Charts #exceltips #excel #shorts #exceltricks...
 0:00:22
Excel vs Google Sheets
 0:00:18
Draw a Multiple Bar Diagram in Excel
 0:00:06
Candlestick Chart Pattern #shorts #
Комментарии