filmov
tv
Tree Diagram for Probability | How to Use It | Must-Know Questions | Detailed Lesson

Показать описание
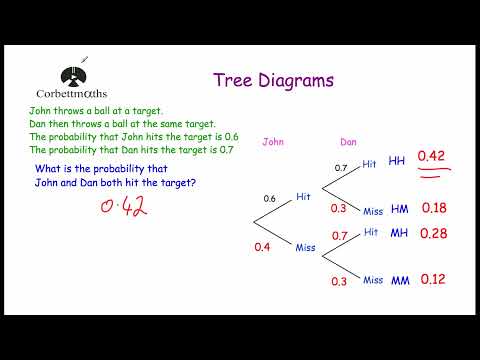
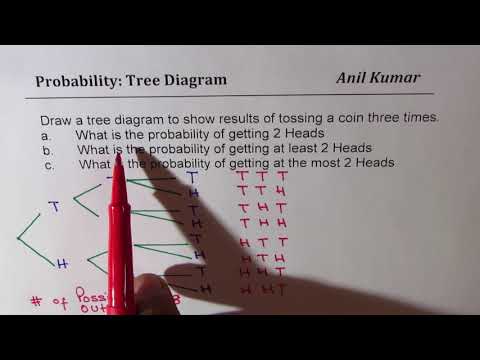
We learn how to use a tree diagram to calculate probabilities.
In this example, 2 paper slips are picked from a box, with replacement, and we see how to list all of the outcomes ( 01:09) and how to calculate the probability of getting:
- 2 blue slips
- Exactly one blue slip
- No blue slips
- At least one blue slip (we use the complement to do this)
We see how to calculate the probabilities written along the branches of the tree and learn that the outcomes of a tree diagram are mutually exclusive (or disjoint).
Time Stamps
00:00 : introduction
02:09 : 2 blue slips
03:24 : exactly one blue slip
04:35 : No blue slips
07:45 : At least one blue slip (using the complement event)
 0:32:52
 0:04:29
 0:02:49
 0:03:19
 0:10:44
 0:16:32
 0:04:29
 0:16:59
 1:08:02
 0:12:18
 0:05:32
 0:11:08
 0:05:36
 0:19:14
 0:13:26
 0:09:22
 0:07:38
 0:04:31
 0:07:36
 0:06:02
 0:17:08
 0:07:58
 0:07:43
 0:19:48