filmov
tv
Introduction to the normal distribution | Probability and Statistics | Khan Academy
Показать описание
Exploring the normal distribution
Missed the previous lesson?
Probability and statistics on Khan Academy: We dare you to go through a day in which you never consider or use probability. Did you check the weather forecast? Busted! Did you decide to go through the drive through lane vs walk in? Busted again! We are constantly creating hypotheses, making predictions, testing, and analyzing. Our lives are full of probabilities! Statistics is related to probability because much of the data we use when determining probable outcomes comes from our understanding of statistics. In these tutorials, we will cover a range of topics, some which include: independent events, dependent probability, combinatorics, hypothesis testing, descriptive statistics, random variables, probability distributions, regression, and inferential statistics. So buckle up and hop on for a wild ride. We bet you're going to be challenged AND love it!
About Khan Academy: Khan Academy offers practice exercises, instructional videos, and a personalized learning dashboard that empower learners to study at their own pace in and outside of the classroom. We tackle math, science, computer programming, history, art history, economics, and more. Our math missions guide learners from kindergarten to calculus using state-of-the-art, adaptive technology that identifies strengths and learning gaps. We've also partnered with institutions like NASA, The Museum of Modern Art, The California Academy of Sciences, and MIT to offer specialized content.
For free. For everyone. Forever. #YouCanLearnAnything
Subscribe to KhanAcademy’s Probability and Statistics channel:
 0:05:27
An Introduction to the Normal Distribution
 0:26:24
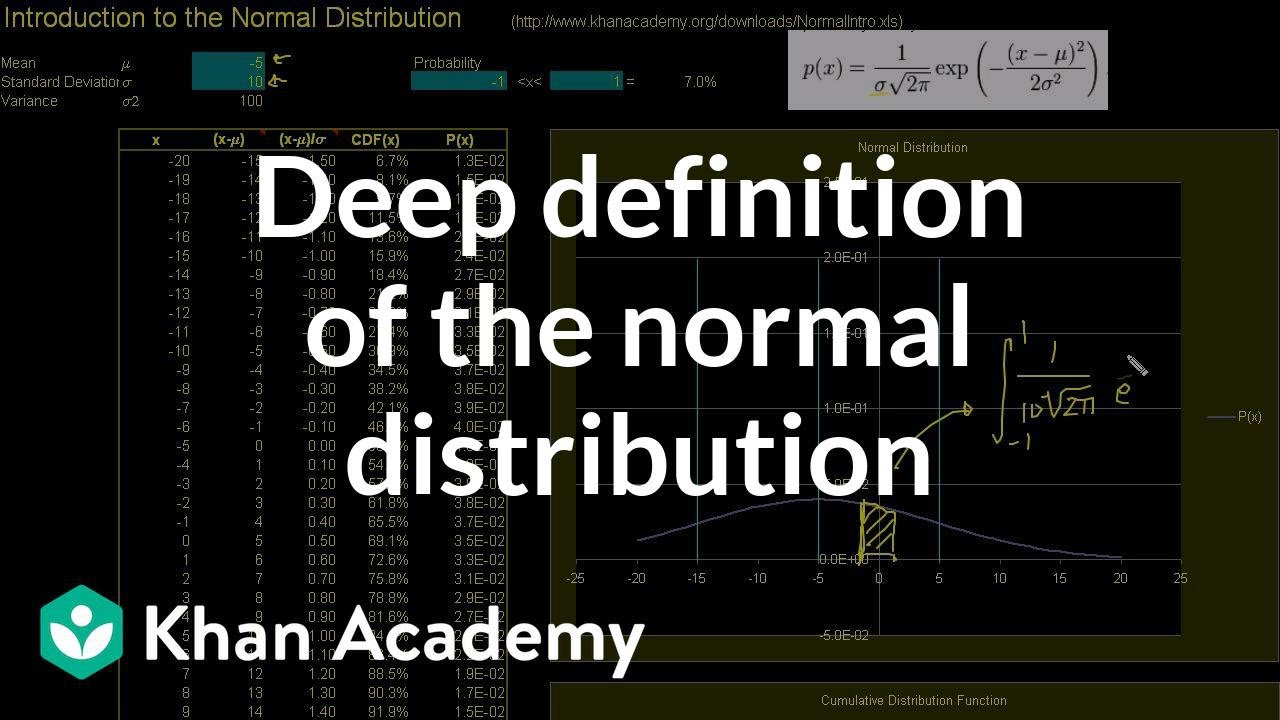
Introduction to the normal distribution | Probability and Statistics | Khan Academy
 0:05:13
The Normal Distribution, Clearly Explained!!!
 0:10:15
Introduction to the Normal Distribution
 0:07:39
Understanding the normal distribution - statistics help #Statistics #Probability
 0:10:59
Normal Distribution EXPLAINED with Examples
 0:11:27
The Normal Distribution: Crash Course Statistics #19
 0:12:11
Intro to the Normal Distribution and how to Calculate Probability
 0:21:26
Waves and Oscillations - Continuous Media : An Introduction to Normal Modes of Continuous Systems
 0:05:31
Y11-12 Mathematics: Introduction to the Normal Distribution
 0:08:50
The Normal Distribution and the 68-95-99.7 Rule (5.2)
 0:01:04
The Bell Curve (Normal/Gaussian Distribution) Explained in One Minute: From Definition to Examples
 0:04:52
Introduction to the Normal Distribution in Statistics (3-8)
 0:06:57
Z-Scores, Standardization, and the Standard Normal Distribution (5.3)
 0:51:03
Standard Normal Distribution Tables, Z Scores, Probability & Empirical Rule - Stats
 0:29:30
Normal Distribution & Probability Problems
 0:05:04
Normal Distribution - Explained Simply (part 1)
 0:05:58
Introduction to the Normal Distribution
 0:05:21
Normal Distribution: Calculating Probabilities/Areas (z-table)
 0:08:04
An Introduction to the Normal Distribution
 0:07:30
Introduction to using the normal distribution - TBS open teaching
 0:11:25
Introduction to the Normal (or Gaussian) Distribution
 0:20:27
03 - The Normal Probability Distribution
 0:06:30
Introduction to the Normal Distribution
Комментарии