filmov
tv
Grafana Loki Promtail | Grafana Loki Setup And Configuration On CentOs

Показать описание
Welcome back to grafana loki tutorial. In this lecture we will see the steps by step process on grafana loki installation.
What is loki grafana?
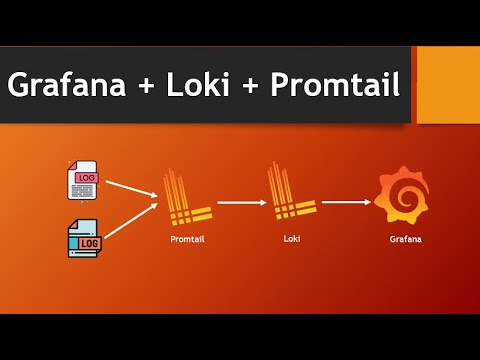
Loki is a horizontally-scalable, highly-available, multi-tenant log aggregation system inspired by Prometheus. It is designed to be very cost effective and easy to operate.
We will also learn benefits of Loki, Grafana Loki Architecture, and Demo in this video.
-----------------------------------------------------------------------------
How to setup grafana on docker:
---------------------------------------------------------------------------
--------------------------------------------------------------------------
MYSQL Grafana Tutorial:
-------------------------------------------------------------------------
------------------------------------------------------------------------
Setup Prometheus as datasource in Grafana
----------------------------------------------------------------------
---------------------------------------------------------------------
Download Grafana :
---------------------------------------------------------------------
-------------------------------------------------------------------
Download Loki and Promtail:
------------------------------------------------------------------
-------------------------------------------------------------------
Download Configuration files :
----------------------------------------------------------------------
-----------------------------------------------------------------------
Commands used:
sudo firewall-cmd --permanent --zone=public --add-port=3000/tcp
sudo firewall-cmd --permanent --zone=public --add-port=3100/tcp
sudo firewall-cmd --permanent --zone=public --add-port=9080/tcp
sudo firewall-cmd --reload
Example queries in Grafana
{filename="/var/log/maillog"}
{job="varlogs"}
---------------------------------------------------------------------------------
========================================
Follow me @:
=======================================
Music credit: "Royalty Free Music from Bensound"
What is loki grafana?
Loki is a horizontally-scalable, highly-available, multi-tenant log aggregation system inspired by Prometheus. It is designed to be very cost effective and easy to operate.
We will also learn benefits of Loki, Grafana Loki Architecture, and Demo in this video.
-----------------------------------------------------------------------------
How to setup grafana on docker:
---------------------------------------------------------------------------
--------------------------------------------------------------------------
MYSQL Grafana Tutorial:
-------------------------------------------------------------------------
------------------------------------------------------------------------
Setup Prometheus as datasource in Grafana
----------------------------------------------------------------------
---------------------------------------------------------------------
Download Grafana :
---------------------------------------------------------------------
-------------------------------------------------------------------
Download Loki and Promtail:
------------------------------------------------------------------
-------------------------------------------------------------------
Download Configuration files :
----------------------------------------------------------------------
-----------------------------------------------------------------------
Commands used:
sudo firewall-cmd --permanent --zone=public --add-port=3000/tcp
sudo firewall-cmd --permanent --zone=public --add-port=3100/tcp
sudo firewall-cmd --permanent --zone=public --add-port=9080/tcp
sudo firewall-cmd --reload
Example queries in Grafana
{filename="/var/log/maillog"}
{job="varlogs"}
---------------------------------------------------------------------------------
========================================
Follow me @:
=======================================
Music credit: "Royalty Free Music from Bensound"
 0:19:15
Grafana Loki for Beginners | Grafana Loki and Promtail | Log Aggregation and Visualization
 0:21:16
Grafana Loki Promtail | Grafana Loki Setup And Configuration On CentOs
 0:11:23
Grafana Loki Tutorial | Grafana Loki Promtail | Log Aggregation and Visualization | #grafana #loki
 0:28:13
Meet Grafana LOKI, a Log Aggregation System for EVERYTHING
 0:13:11
Promtail Loki Grafana Using Docker Compose | Grafana Loki Demo
 0:30:21
Mastering Grafana Loki: Complete Guide to Installation, Configuration, and Integration | Part 1
 0:03:47
Getting started with Grafana Loki - under 4 minutes
 0:05:19
Get started with observability with Grafana, Loki, and Promtail
 0:05:00
How to Ship Logs to Grafana Loki with Promtail, FluentD & Fluent-bit
 0:13:23
Grafana Loki querying basics, log based metrics and setting alerts on logs
 0:03:17
Effective troubleshooting with Grafana Loki - query basics
 0:22:17
How to forward Logs to Grafana Loki using Promtail | Install Grafana Loki | Install Promtail Agent
 0:27:16
Grafana Mastery | Install Grafana, Loki & Promtail for Powerful Data Visualization
 0:26:04
Grafana Loki to access Kubernetes logs
 0:11:13
How to install Grafana Loki (Promtail, Loki and Grafana) using Helm
 0:15:54
How To Setup Grafana Loki Promtail On Docker
 0:28:46
How to collect logs in k8s with Loki and Promtail
 0:17:48
grafana loki promtail logging tutorial- how to do log parsing via promtail via helm & extract la...
 0:16:21
How to Forward Logs to Grafana Loki using Promtail | Install Grafana Loki | Install Promtail Agent
 0:02:48
Grafana Loki 2.3: Easier & Faster Querying
 0:25:01
Mastering Grafana Loki: Kubernetes Log Collection & Integration | Part 2
 1:03:11
Getting started with Grafana Loki (Grafana Office Hours #09)
 0:06:35
Demystifying Grafana, Loki, and Promtail | An In-Depth Overview and Their Practical Applications
 0:03:49
Loki Log Context Query Editor in Grafana 10
Комментарии