filmov
tv
#45 Software Tracing with printf

Показать описание
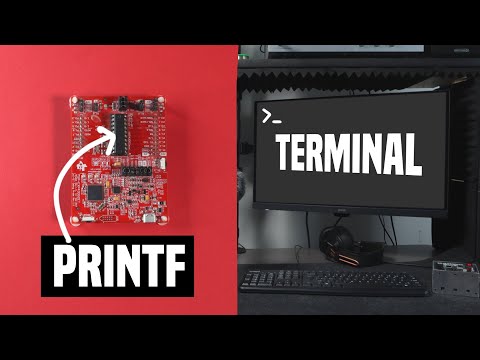
This lesson explains "debugging by printf" as the most common software tracing technique. You'll learn how to implement printf on the TivaC LaunchPad board, as well as NUCLEO-L152. You'll also explore some shortcomings of this primitive technique.
Contents with Timestamps:
-------------------------
3:18 Adding printf tracing to the BSP code
4:25 Attempts to run and the hardcoded breakpoints
6:00 MicroLIB and the fputc() function
7:25 Instrumentation Trace Macrocell (ITM)
8:00 Demonstration of STM32 NUCLEO board
8:50 Sending output via ITM
9:40 Setting up ST-LINK for tracing with ITM
9:55 Opening view "Debug (printf) Viewer"
10:58 Universal Asynchronous Receiver and Transmitter (UART)
12:11 Code for sending printf output via UART in TivaC
14:19 Opening and connecting serial terminal (Termite)
16:25 Tracing macros (variadic macros and __VA_ARGS__)
19:42 Build Configurations
20:18 Creating the "spy" build configuration for software tracing
22:35 Costs and overheads of printf tracing
23:40 Impact of floating-point format specification
24:45 Impact of printf tracing on execution time
End Notes:
----------
Companion web-page to this video course
Project download for this lesson:
GitHub repository for projects for this video course:
Transcript of this lesson:
References resources:
---------------------
Termite -- a simple RS232 terminal:
STM NUCLEO-L152RE board
Instrumentation Trace Macrocell
Music credits:
--------------
The background music comes from:
Комментарии
 0:27:53
 0:26:37
 0:02:07
 0:38:22
 0:05:13
 0:05:12
 0:35:13
 0:35:12
 0:06:00
 0:17:33
 0:17:30
 0:06:17
 0:11:50
 0:43:45
 0:21:24
 0:20:25
 0:01:19
 0:15:45
 0:32:23
 0:17:44
 0:00:45
 0:26:53
 0:55:18
 0:23:46