filmov
tv
Calculating Critical Values for T Distribution in Excel and Building Chart

Показать описание
This video demonstrates how to calculate critical values for the t distribution in Excel and construct a critical value chart. These critical values are compared with the t statistic from Independent-Samples or Paired-Samples (Dependent-Samples) T Tests to determine if there is statistical significance.
 0:03:59
Example finding critical t value
 0:01:44
t critical value using the t-distribution table
 0:01:51
Find critical value t for a confidence interval (t-Distribution)
 0:03:48
How to Calculate Critical Values from T Distribution in Excel. [HD]
 0:07:47
Calculating Critical Values for T Distribution in Excel and Building Chart
 0:03:06
How to find critical values for a hypothesis test using a z or t table
 0:05:41
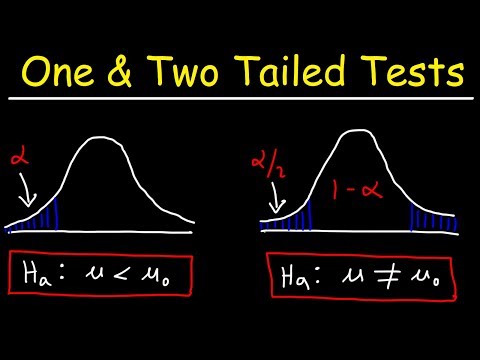
One Tailed and Two Tailed Tests, Critical Values, & Significance Level - Inferential Statistics
 0:00:19
Critical Values 0.01 - Intro to Inferential Statistics
 0:05:37
P Values, z Scores, Alpha, Critical Values
 0:00:58
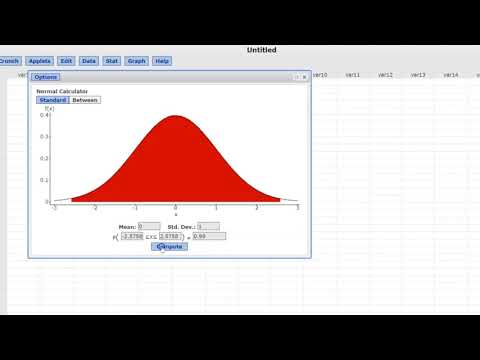
Finding Critical Values using Statcrunch.
 0:21:19
Finding Critical Numbers
 0:00:12
Two-Tailed Critical Values 0.01 - Intro to Inferential Statistics
 0:07:50
Hypothesis Testing - How To Find Rejection Regions And Critical Values Using A Z Test
 0:01:33
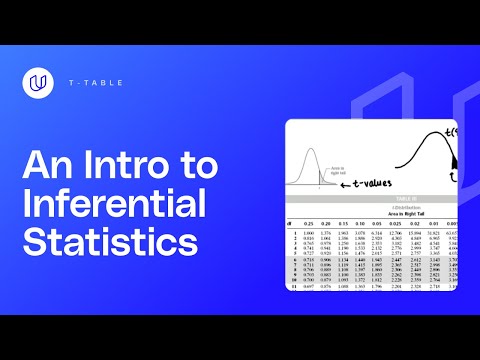
t-Table - Intro to Inferential Statistics
 0:04:52
Finding z critical values using a z table
 0:00:26
How to find z critical value for any confidence interval with MS Excel
 0:07:26
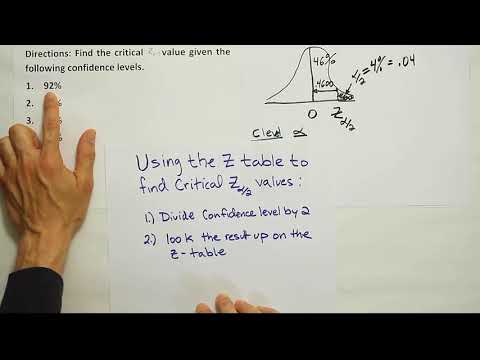
How To Find The Z Score Given The Confidence Level of a Normal Distribution 2
 0:02:20
P-value from t-table | How to estimate P-value without software
 0:07:23
Finding z critical values using a z table
 0:10:11
Student's t-test
 0:00:38
Find critical value Z a 2 that corresponds to a=0 003 TI84+CE Calculator OCC Math 160 Stats
 0:06:17
How to Find a Critical Value Using a T-table
 0:16:42
Edexcel AS Level Maths: 7.2 Finding Critical Values (Part 1) - Critical Region One-Tailed Test
 0:04:53
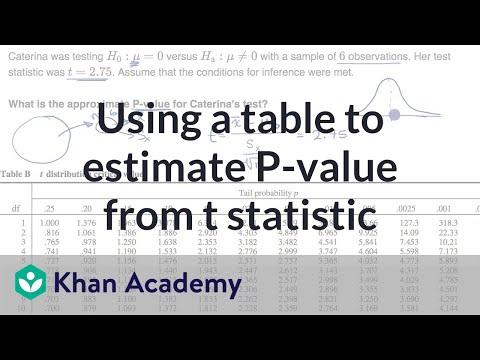
Using a table to estimate P-value from t statistic | AP Statistics | Khan Academy
Комментарии