filmov
tv
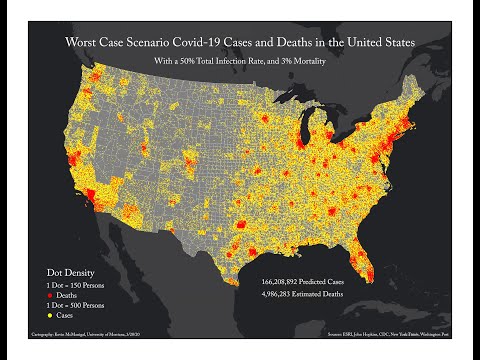
GIS Apps - Lab 4 - Dot Density Mapping of Covid-19 in the US - ArcGIS Pro

Показать описание
This lab covers creating dot density maps of current corona virus cases and deaths in the United States. It uses regularly updated data from the CDC. I also cover how to calculate and map Best\Worst case scenarios for infections and mortality. Below is a link to the instructions with citations for all the data and statistics. Please like and subscribe. Thanks.
 0:21:49
GIS Apps - Lab 4 - Dot Density Mapping of Covid-19 in the US - ArcGIS Pro
 1:34:01
CE375 GIS Applications: Zoom Lab 4-20200925
 1:11:45
GIS Lab 4
 1:25:08
CE375: Zoom Recording for Lab 4 GIS 2020/09/18
 0:15:55
GIS Lab Exercise 4
 0:30:35
lab 4 gis tutorial class
 0:59:54
Introduction to GIS Lab Exercise 04
 1:25:46
Web GIS Lab-4
 0:01:48
GIS Lab 2018 - UrbanX
 0:31:40
GIS Apps – Lab 3 – Isarithmic Maps of Paleoclimate Data – ArcGIS Pro
 0:02:33
GIS LAB 4 BY ALI HAIDER
 0:22:38
APPLiED GiS LAB4 Training
 0:16:08
Stef's GIS Lab - ArcGIS Pro Tutorial - ModelBuilder 4 - Creating an Ecosystem model
 0:04:47
Pre-Lab Procedure for All ArcGIS Activities in the UMFK GIS Lab
 1:04:21
RS & GIS Training Practical Session 4
 0:21:46
QGIS - Quantum GIS : Software Application Lab
 0:05:02
MMS3553 REMOTE SENSING AND GIS - LAB 4 (GROUP 14)
 0:02:02
GIS LAB demo
 0:56:49
GIS Technology Challenges - GIS Peer Success Webinar Ep. 4
 0:12:52
GIS 311 Lab X Part 1 of 4 | A GIS ArcMap 10.7 Tutorial by Gregory Lund, University of WA, Tacoma.
 0:22:28
GIS Apps – Lab 1, Part 2 – GWR Analysis with Choropleth Maps – ArcGIS Pro
 0:48:52
GIS 311 Lab X Part 4 | a GIS ArcMap 10.7 Tutorial by Gregory Lund, University of WA, Tacoma.
 0:12:21
Develop ArcGIS Android Mobile GIS and GPS Apps : Display a Basemap
 1:01:21
GVPT 392 GIS Lab Chapter4: Combining Data from Different Sources
Комментарии