filmov
tv
Python Data Visualization: Embedding Multiple Charts In Matplotlib

Показать описание
Combining multiple charts in a single figure allows viewers to compare and contrast different datasets or aspects of a dataset more easily. This helps to tell a more comprehensive story with the data, making it more informative and engaging. In this tutorial, we will learn how to create a captivating figure with multiple charts using Matplotlib.
► Buy Me a Coffee? Your support is much appreciated!
-------------------------------------------------------------------------------------------
☕ Venmo: @Jie-Jenn
► Support my channel so I can continue making free contents
---------------------------------------------------------------------------------------------------------------
#matplotlib #datavisualization #python
 0:11:52
Python Data Visualization: Embedding Multiple Charts In Matplotlib
 0:08:24
Visualizing High Dimension Data Using UMAP Is A Piece Of Cake Now
 0:01:54
Data Visualization Libraries For Python
 0:03:17
A.I. Experiments: Visualizing High-Dimensional Space
 0:01:04
I Create Dashboard in One Minute using Python | Python for beginners | #python #coding #programming
 0:07:57
Matplotlib Series Part#17 - Creating Multiple Subplots
 0:04:23
Vector Databases simply explained! (Embeddings & Indexes)
 0:09:20
Multi-Dimensional Data (as used in Tensors) - Computerphile
 0:15:54
Make Modern Python Dashboards With Tkinter & Matplotlib!
 0:00:28
The HARDEST part about programming 🤦♂️ #code #programming #technology #tech #software #developer...
 0:15:53
Visualizing Excel Files Easily With Python
 0:01:43
Quick explanation: One-hot encoding
 0:12:28
Data Visualization using Python on Jupyter Notebook
 0:03:24
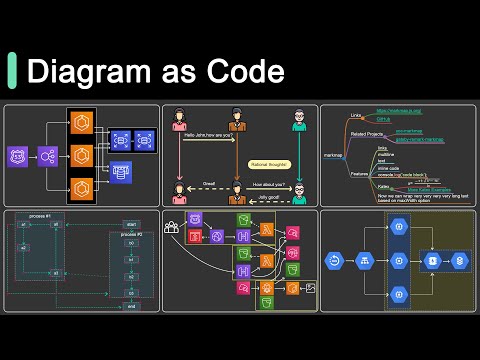
Top 6 Tools to Turn Code into Beautiful Diagrams
 0:09:40
My Workflow for Building any Streamlit Dashboard Project
 0:06:38
How to embed Matplotlib Graph in a PyQt5 application
 0:37:00
Power of Visualizing Embeddings
 0:00:53
Will Polars replace Pandas for Data Science?
 0:19:01
Introducing Python in Excel
 0:00:29
Folders & files in VS Code made super fast like this!
 0:22:45
Data Visualization - Plot Single, Multiple Line Chart using Matplotlib in Python, Use Various Marker
 0:19:10
Interactive Web Visualizations with Bokeh in Python
 0:30:13
Multi Dimensional Linked Data Exploration with Glue | SciPy 2019 | Thomas Robitaille
 0:24:30
Text Embeddings, Classification, and Semantic Search (w/ Python Code)
Комментарии