filmov
tv
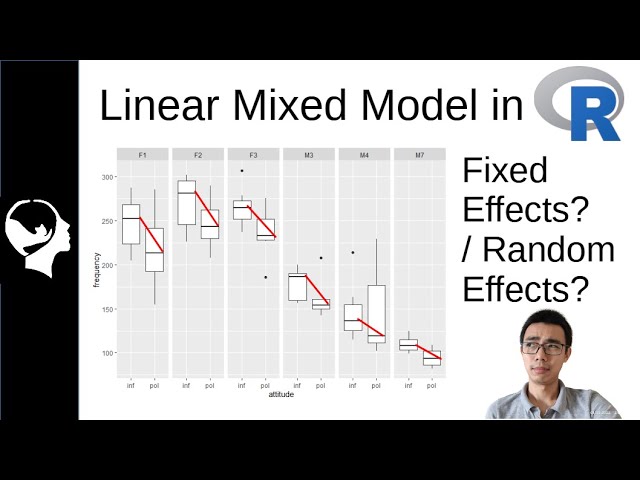
(Simplified) Linear Mixed Model in R with lme()
Показать описание
Statistical modeling helps to compress the raw data we have into a simple mathematical formula that we can use for understanding the relationship between two or more variables, or in some situation, use to predict data from new input.
Simple linear model could easily help to model the relationship between two directly correlated variables, but in most cases, the world is too complicated to simple linear model. In this case, linear mixed model comes into play. Incorporating both fixed effects and random effects, this modeling technique attempt to prevent a false negative correlation between the variables, or mis interpretation of the trends.
This video is attempting to summarize the concept of modeling and how you can run LMM in R.
Scripts
Slides
Original tutorial
 0:11:27
Linear mixed effects models - the basics
 0:26:17
(Simplified) Linear Mixed Model in R with lme()
 0:18:37
Linear mixed effects models
 0:18:28
Mixed Models, Hierarchical Linear Models, and Multilevel Models: A simple explanation
 0:17:30
Simple Explanation of Mixed Models (Hierarchical Linear Models, Multilevel Models)
 0:11:33
How to decide whether an effect is fixed or random in mixed models
 0:17:02
Mixed Effects Models Part 1: What is a Mixed Effects Model?
 0:08:09
Fixed and random effects with Tom Reader
 0:04:51
Linear Mixed Methods on SPSS
 0:30:08
Lingstats - Lecture #29 - Linear Mixed Effects Models, part 1
 0:18:21
Mixed Model Analysis: Real Example
 0:10:46
SPSS #39 Mixed Linear Model
 0:11:32
Mixed Model ANOVA (Analysis of Variance) Simply explained
 0:09:51
L11.1: Intro to Linear Mixed Models
 0:15:38
Fitting mixed models in R (with lme4)
 0:20:42
Mixed Model Notation - A Simple Explanation
 1:36:19
Part 1: Linear Mixed Models
 0:15:19
Linear mixed effect models in Jamovi | 1 | Introduction
 0:11:13
Lecture 9.1 Introduction to Mixed Effects Models
 0:06:40
Multilevel and mixed models, random and fixed part
 0:20:19
Understanding Generalized Linear Models (Logistic, Poisson, etc.)
 0:05:24
Linear Models vs. Generalized Linear Models
 0:08:23
Easy way to extract estimates from mixed models
 0:10:32
Explaining Variance Explained in Mixed Models
Комментарии