filmov
tv
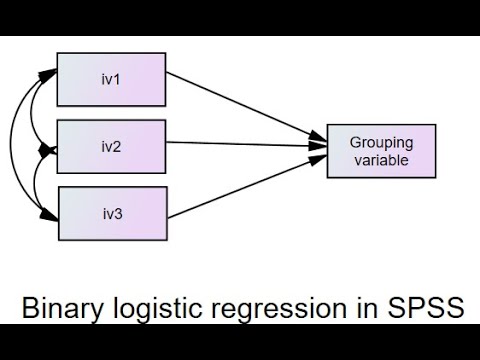
Binary logistic regression using SPSS (June 2019)
Показать описание
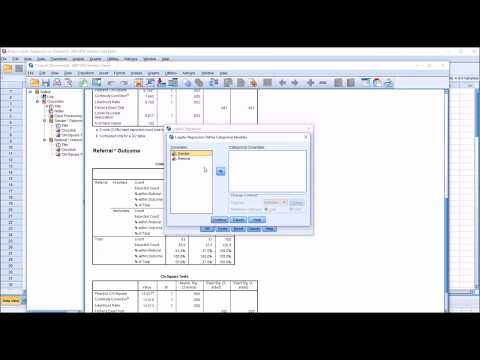
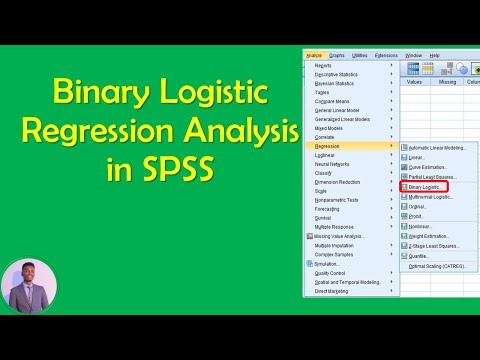
This video provides an overview of binary logistic regression and demonstrates how to carry out this analysis using example data in SPSS. A copy of the Powerpoint used in the video can be downloaded here:
A copy of the data used in the video can be downloaded here:
I HAVE ANOTHER POWERPOINT (created March 2020), called "Binary logistic regression: A deeper dive into understanding and interpreting your SPSS results", can can freely download here:
Running document with links to other videos:
A copy of the data used in the video can be downloaded here:
I HAVE ANOTHER POWERPOINT (created March 2020), called "Binary logistic regression: A deeper dive into understanding and interpreting your SPSS results", can can freely download here:
Running document with links to other videos:
 0:10:20
Binary Logisitic Regression in SPSS with One Continuous and One Dichotomous Predictor Variable
 0:22:40
Binary Logistic Regression Analysis using SPSS: What it is, How to Run, and Interpret the Results.
 0:09:54
MASTERING SPSS - BINARY LOGISTIC REGRESSION WITH SPSS
 0:34:51
Binary Logistic Regression Analysis in SPSS
 0:46:19
Binary logistic regression using SPSS 29 (Part 1; August 2023)
 0:12:15
Performing Logistic Regression in SPSS
 0:16:04
BINARY LOGISTIC REGRESSION USING SPSS
 0:15:33
Testing assumptions for Binary Logistic Regression using SPSS
 0:09:33
Interpreting Odds Ratio with Two Independent Variables in Binary Logistic Regression using SPSS
 0:11:53
Binary logistic regression using SPSS menus (short demo; July, 2019)
 0:19:32
Testing the Assumptions for Binary Logistic Regression using SPSS
 0:30:51
Binary logistic regression using SPSS 29 (Part 2; August 2023)
 0:31:13
Binary logistic regression in SPSS (March 2021)
 0:16:35
Binary Logistic Regression using SPSS :- by G N Satish Kumar
Binary logistic regression using SPSS (June 2019)
 0:11:52
Interpreting the Odds Ratio in Logistic Regression using SPSS
 0:14:44
Binary Logisitic Regression in SPSS with Two Dichotomous Predictor Variables
 0:12:11
Interpreting binary logistic regression output (SPSS demo, 2018)
 0:10:36
Binary Logistic Regression in SPSS (Amharic tutorial by Ebrahim (guest tutor))
 0:22:42
Bivariate and Multivariate Binary Logistic Regression Using SPSS Part II Amharic lecture
 0:08:38
Logistic regression with categorical predictors in SPSS
 0:23:44
Multilevel binary logistic regression using IBM SPSS (March 2020)
 0:17:32
V17.4 Multiple Binary Logistic Regression in SPSS
 0:26:02
Forward, backward, and hierarchical binary logistic regression in SPSS
Комментарии